
Global Energy Facts
The Energy Institute (energyinst.org) does publish an annual statistical review of the world's energy production and consumption. The 2025 edition (with data for year 2024, graphics by ourworldindata) contains some interesting facts:
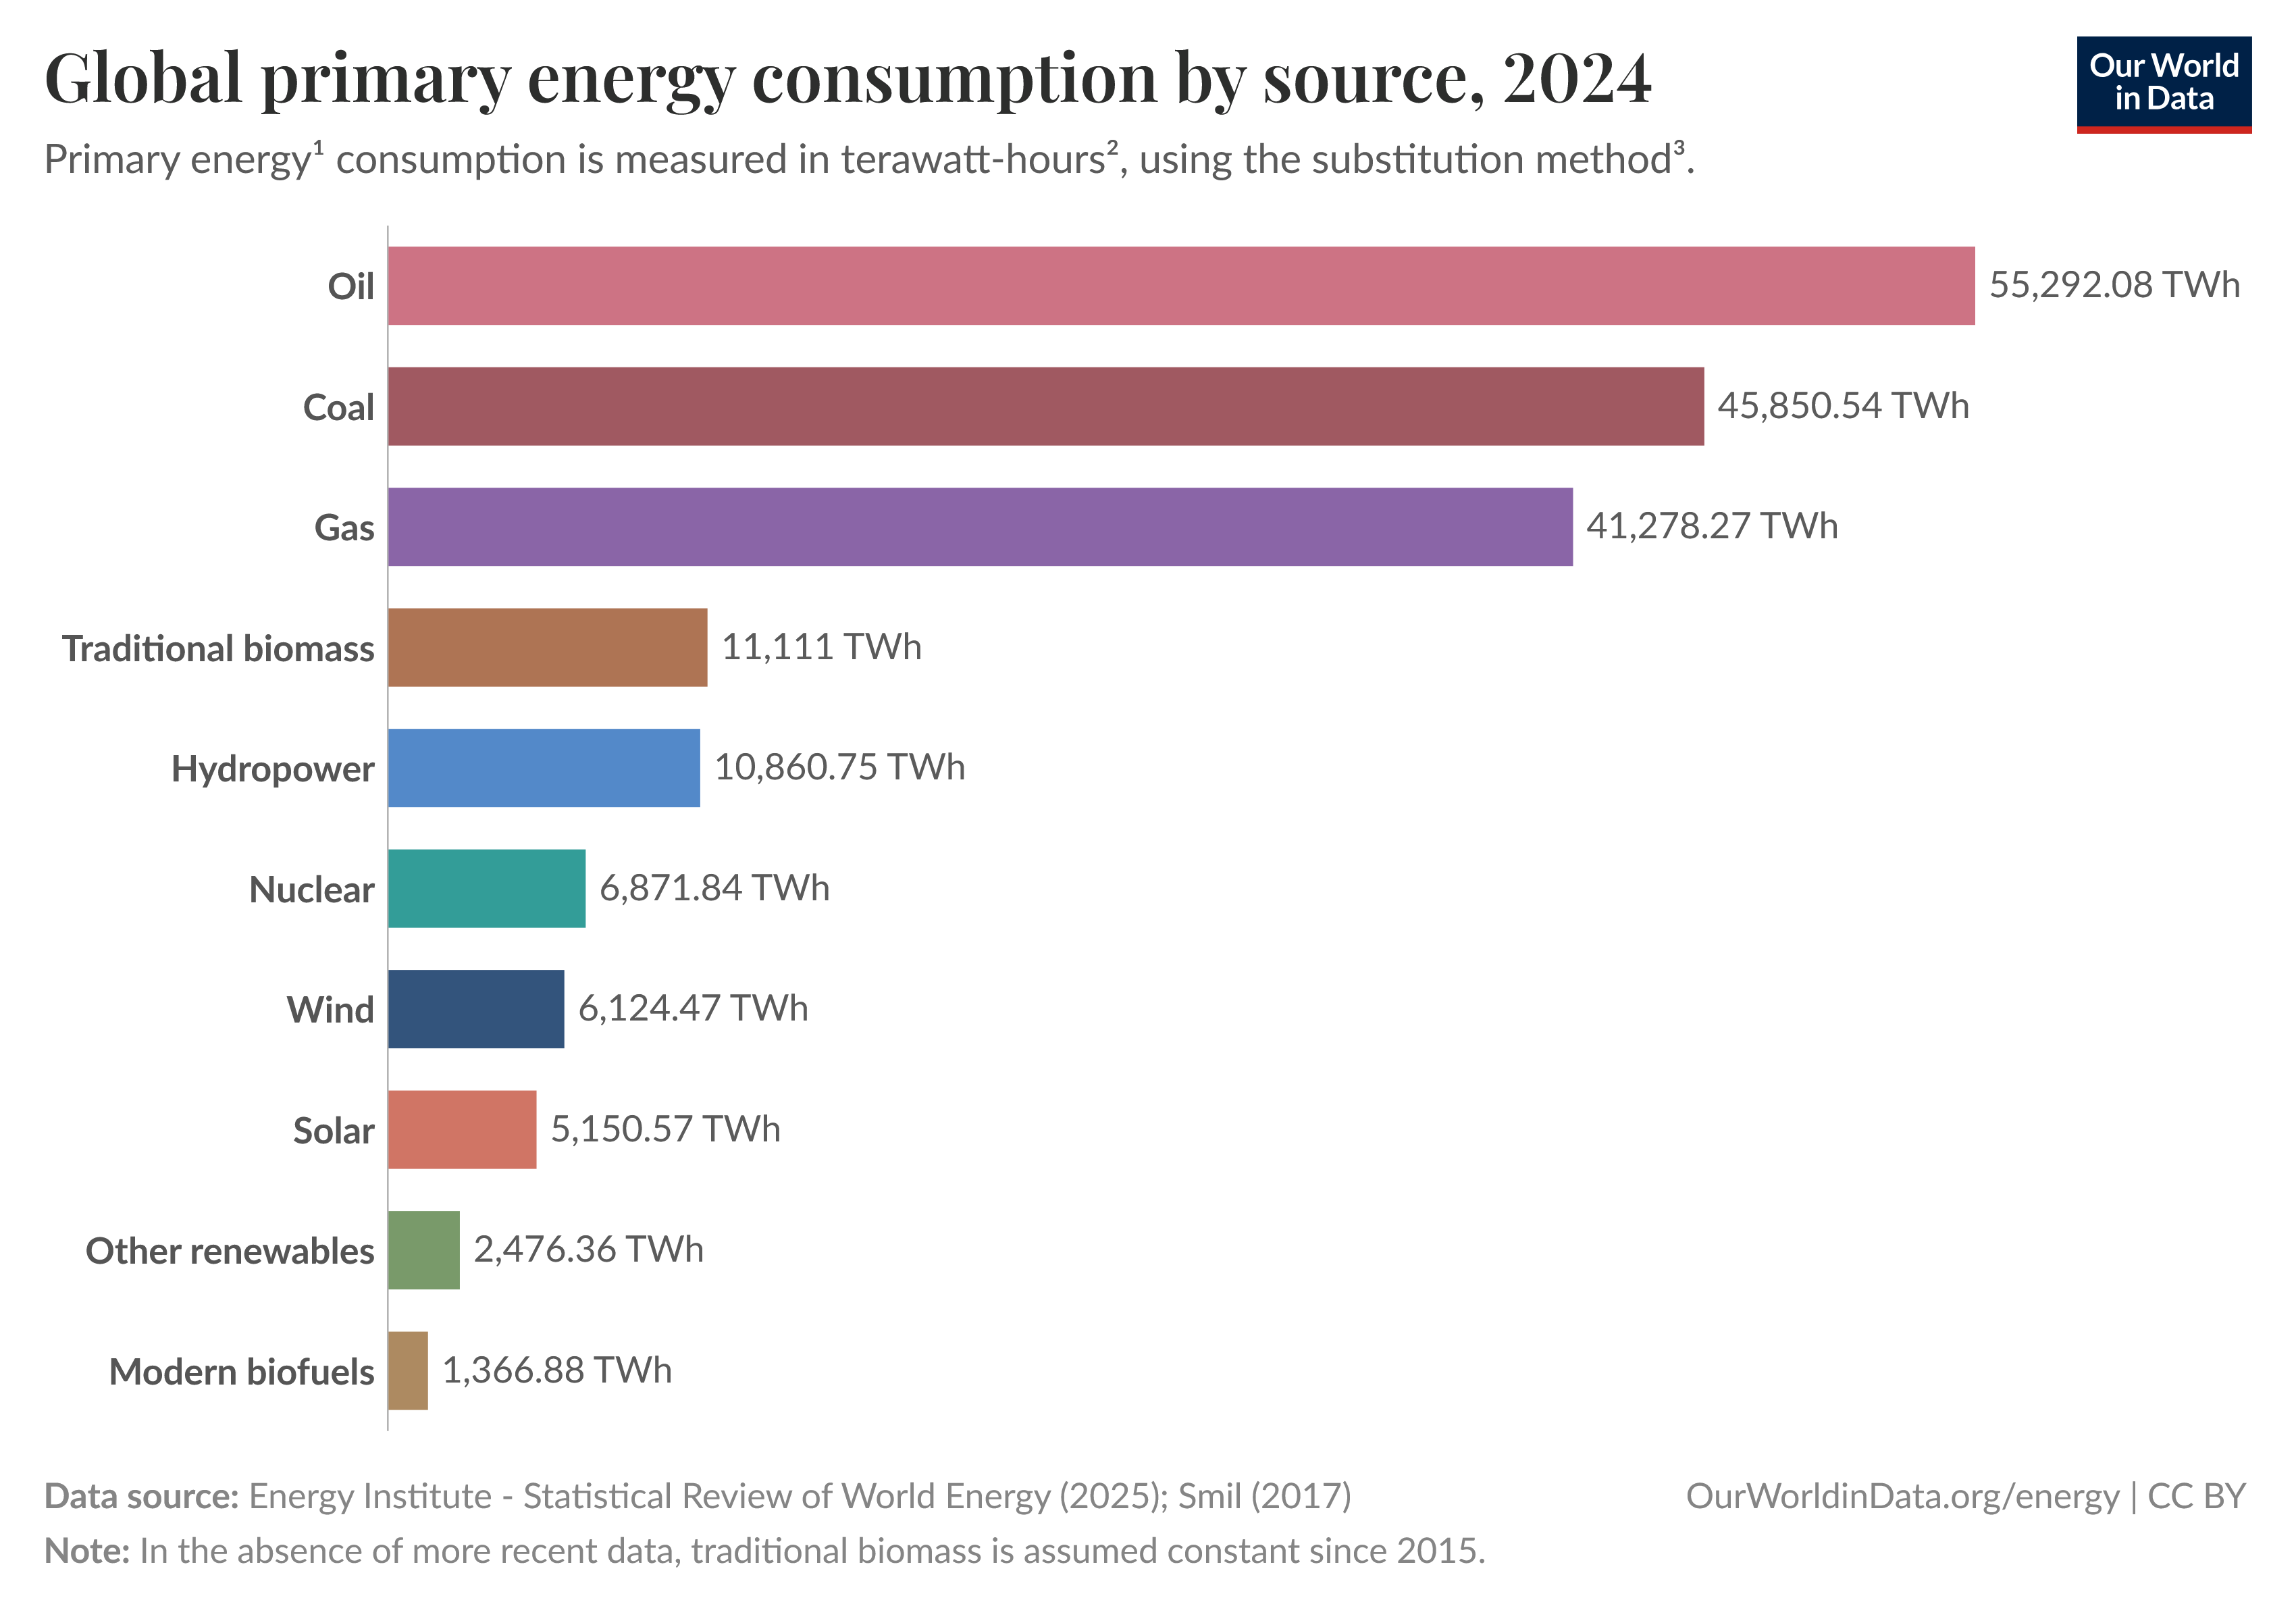
The world consumed ≈ 177 000 TWh of primary energy in 2024. Oil, coal and natural gas are the dominant sources (Fig. 1). CO2-free sources such as solar and wind ("renewables"), bioenergy, hydro- and nuclear power delivered less than 20% (for the statistical methods used see the note below).
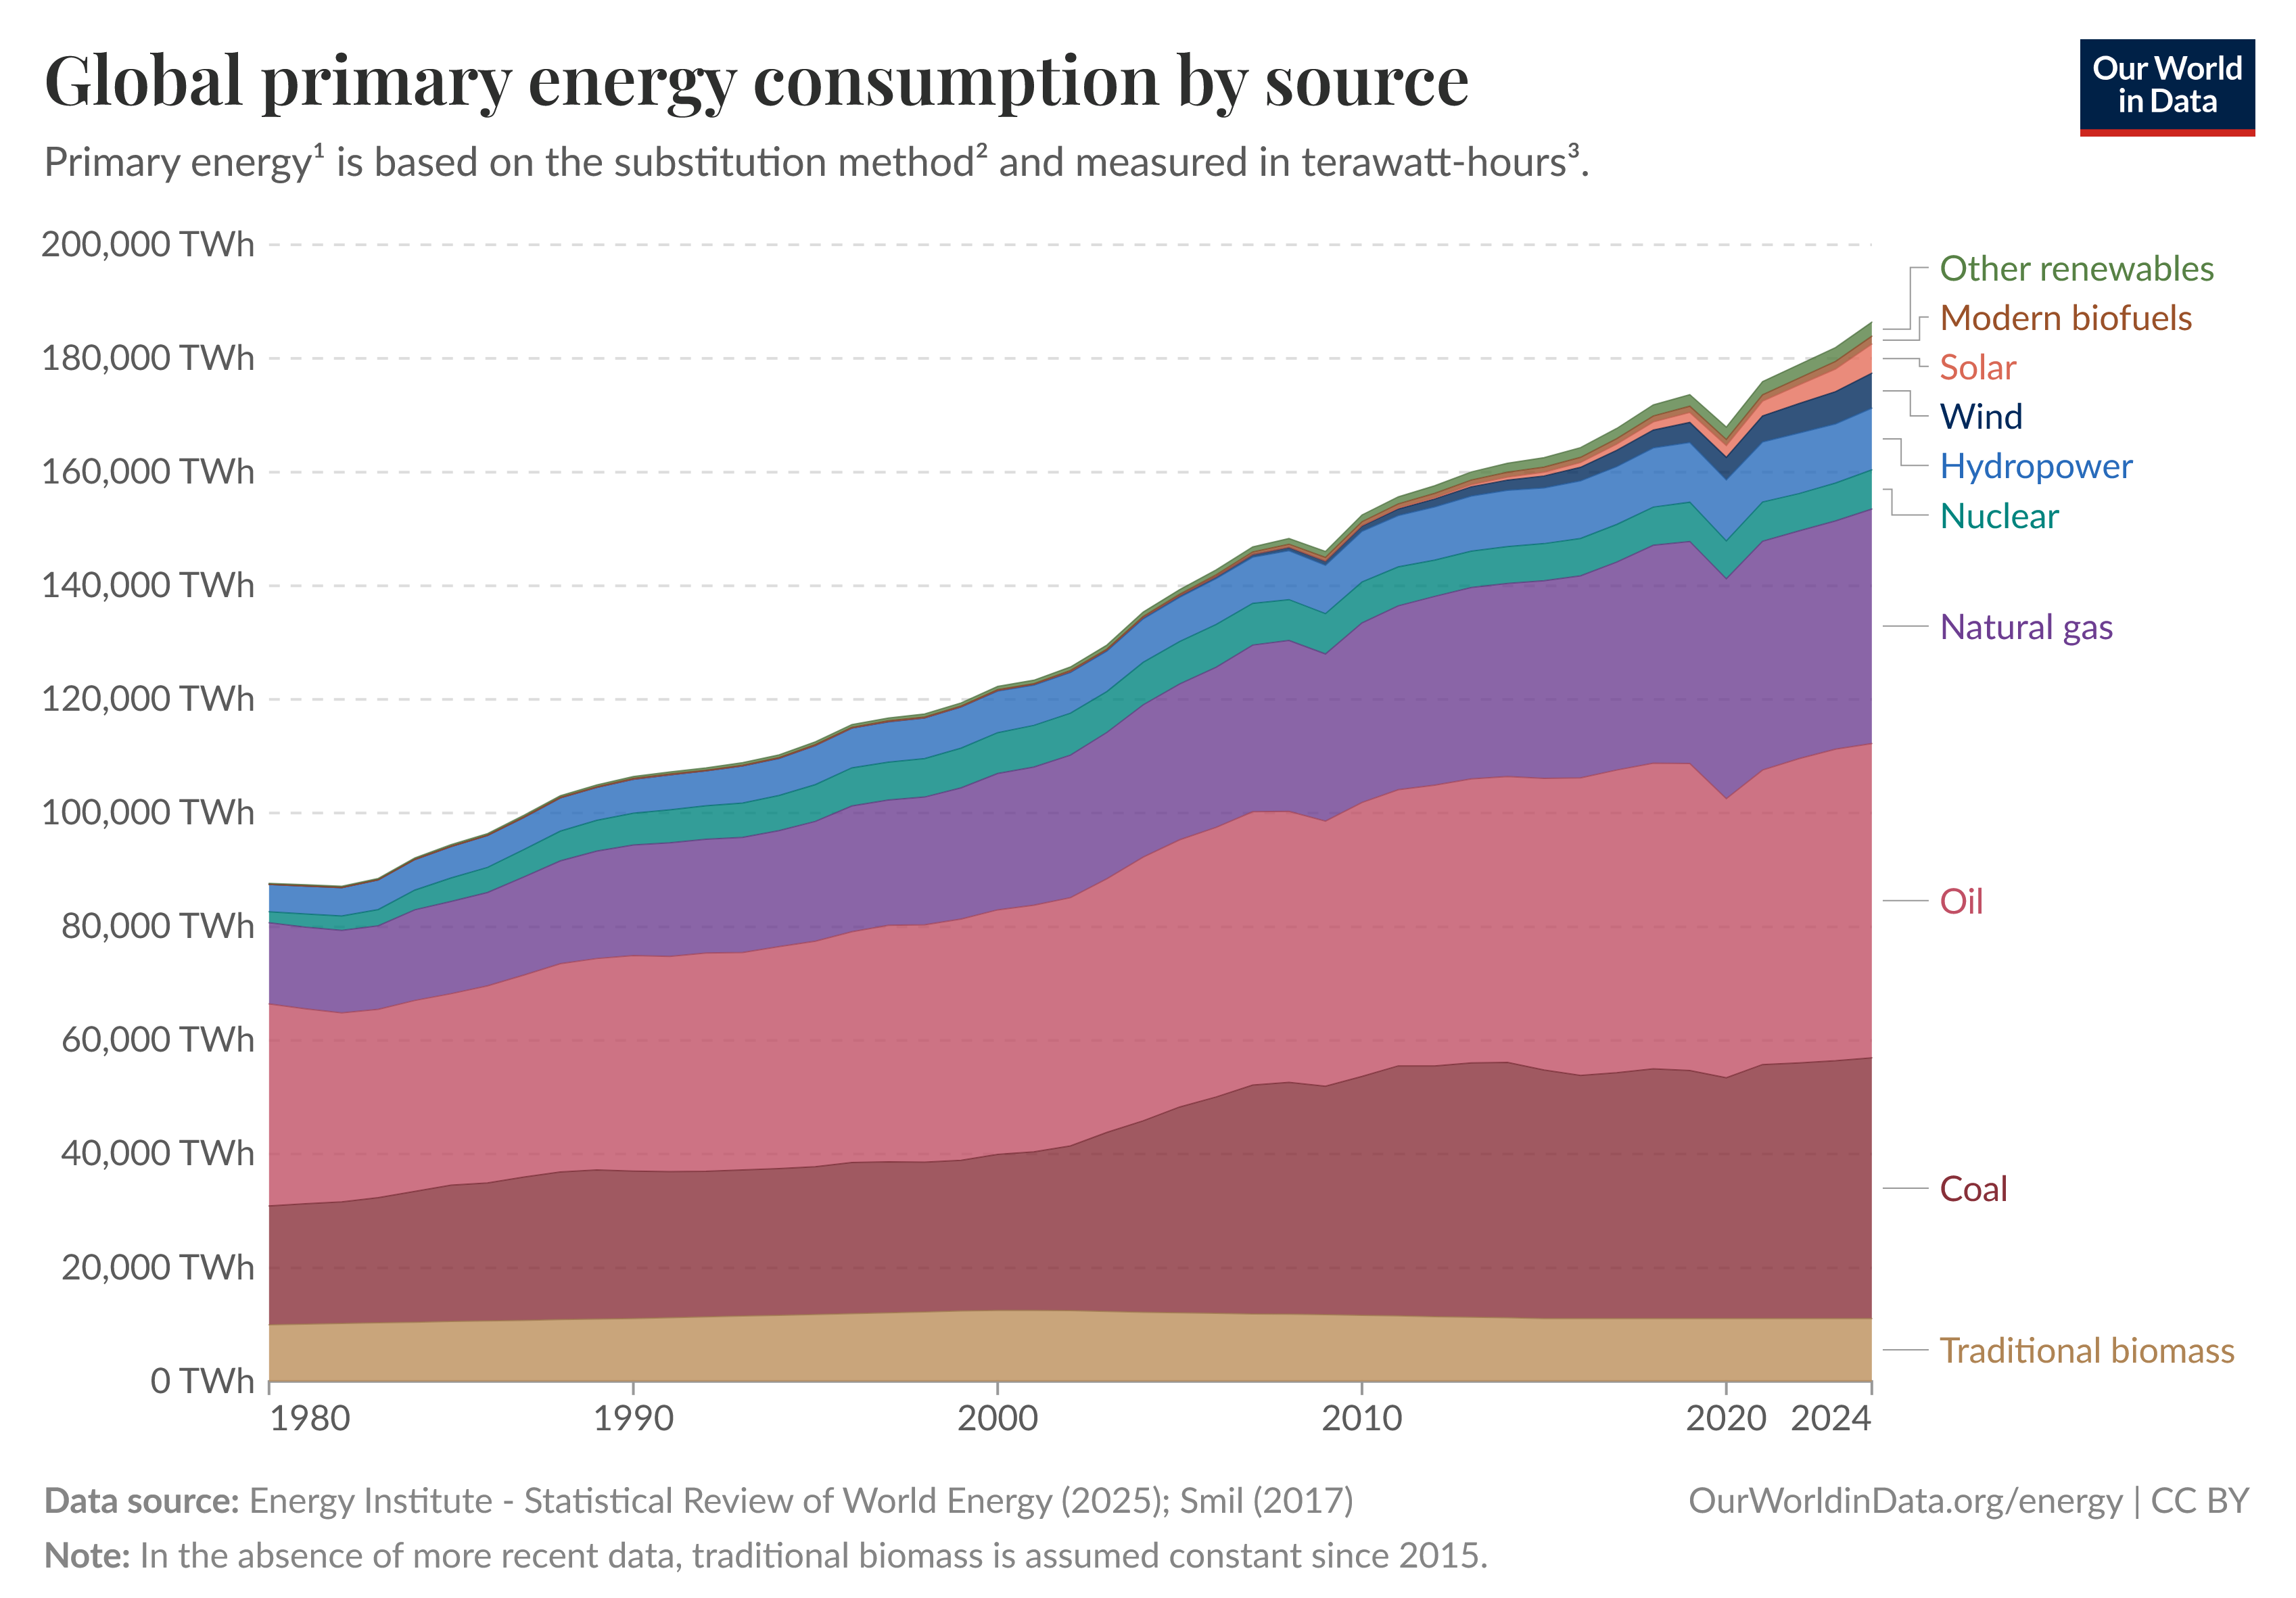
Despite all the talk about global warming caused by CO2 emissions, energy consumption, including fossil fuels, is still rising steeply (Fig. 2)
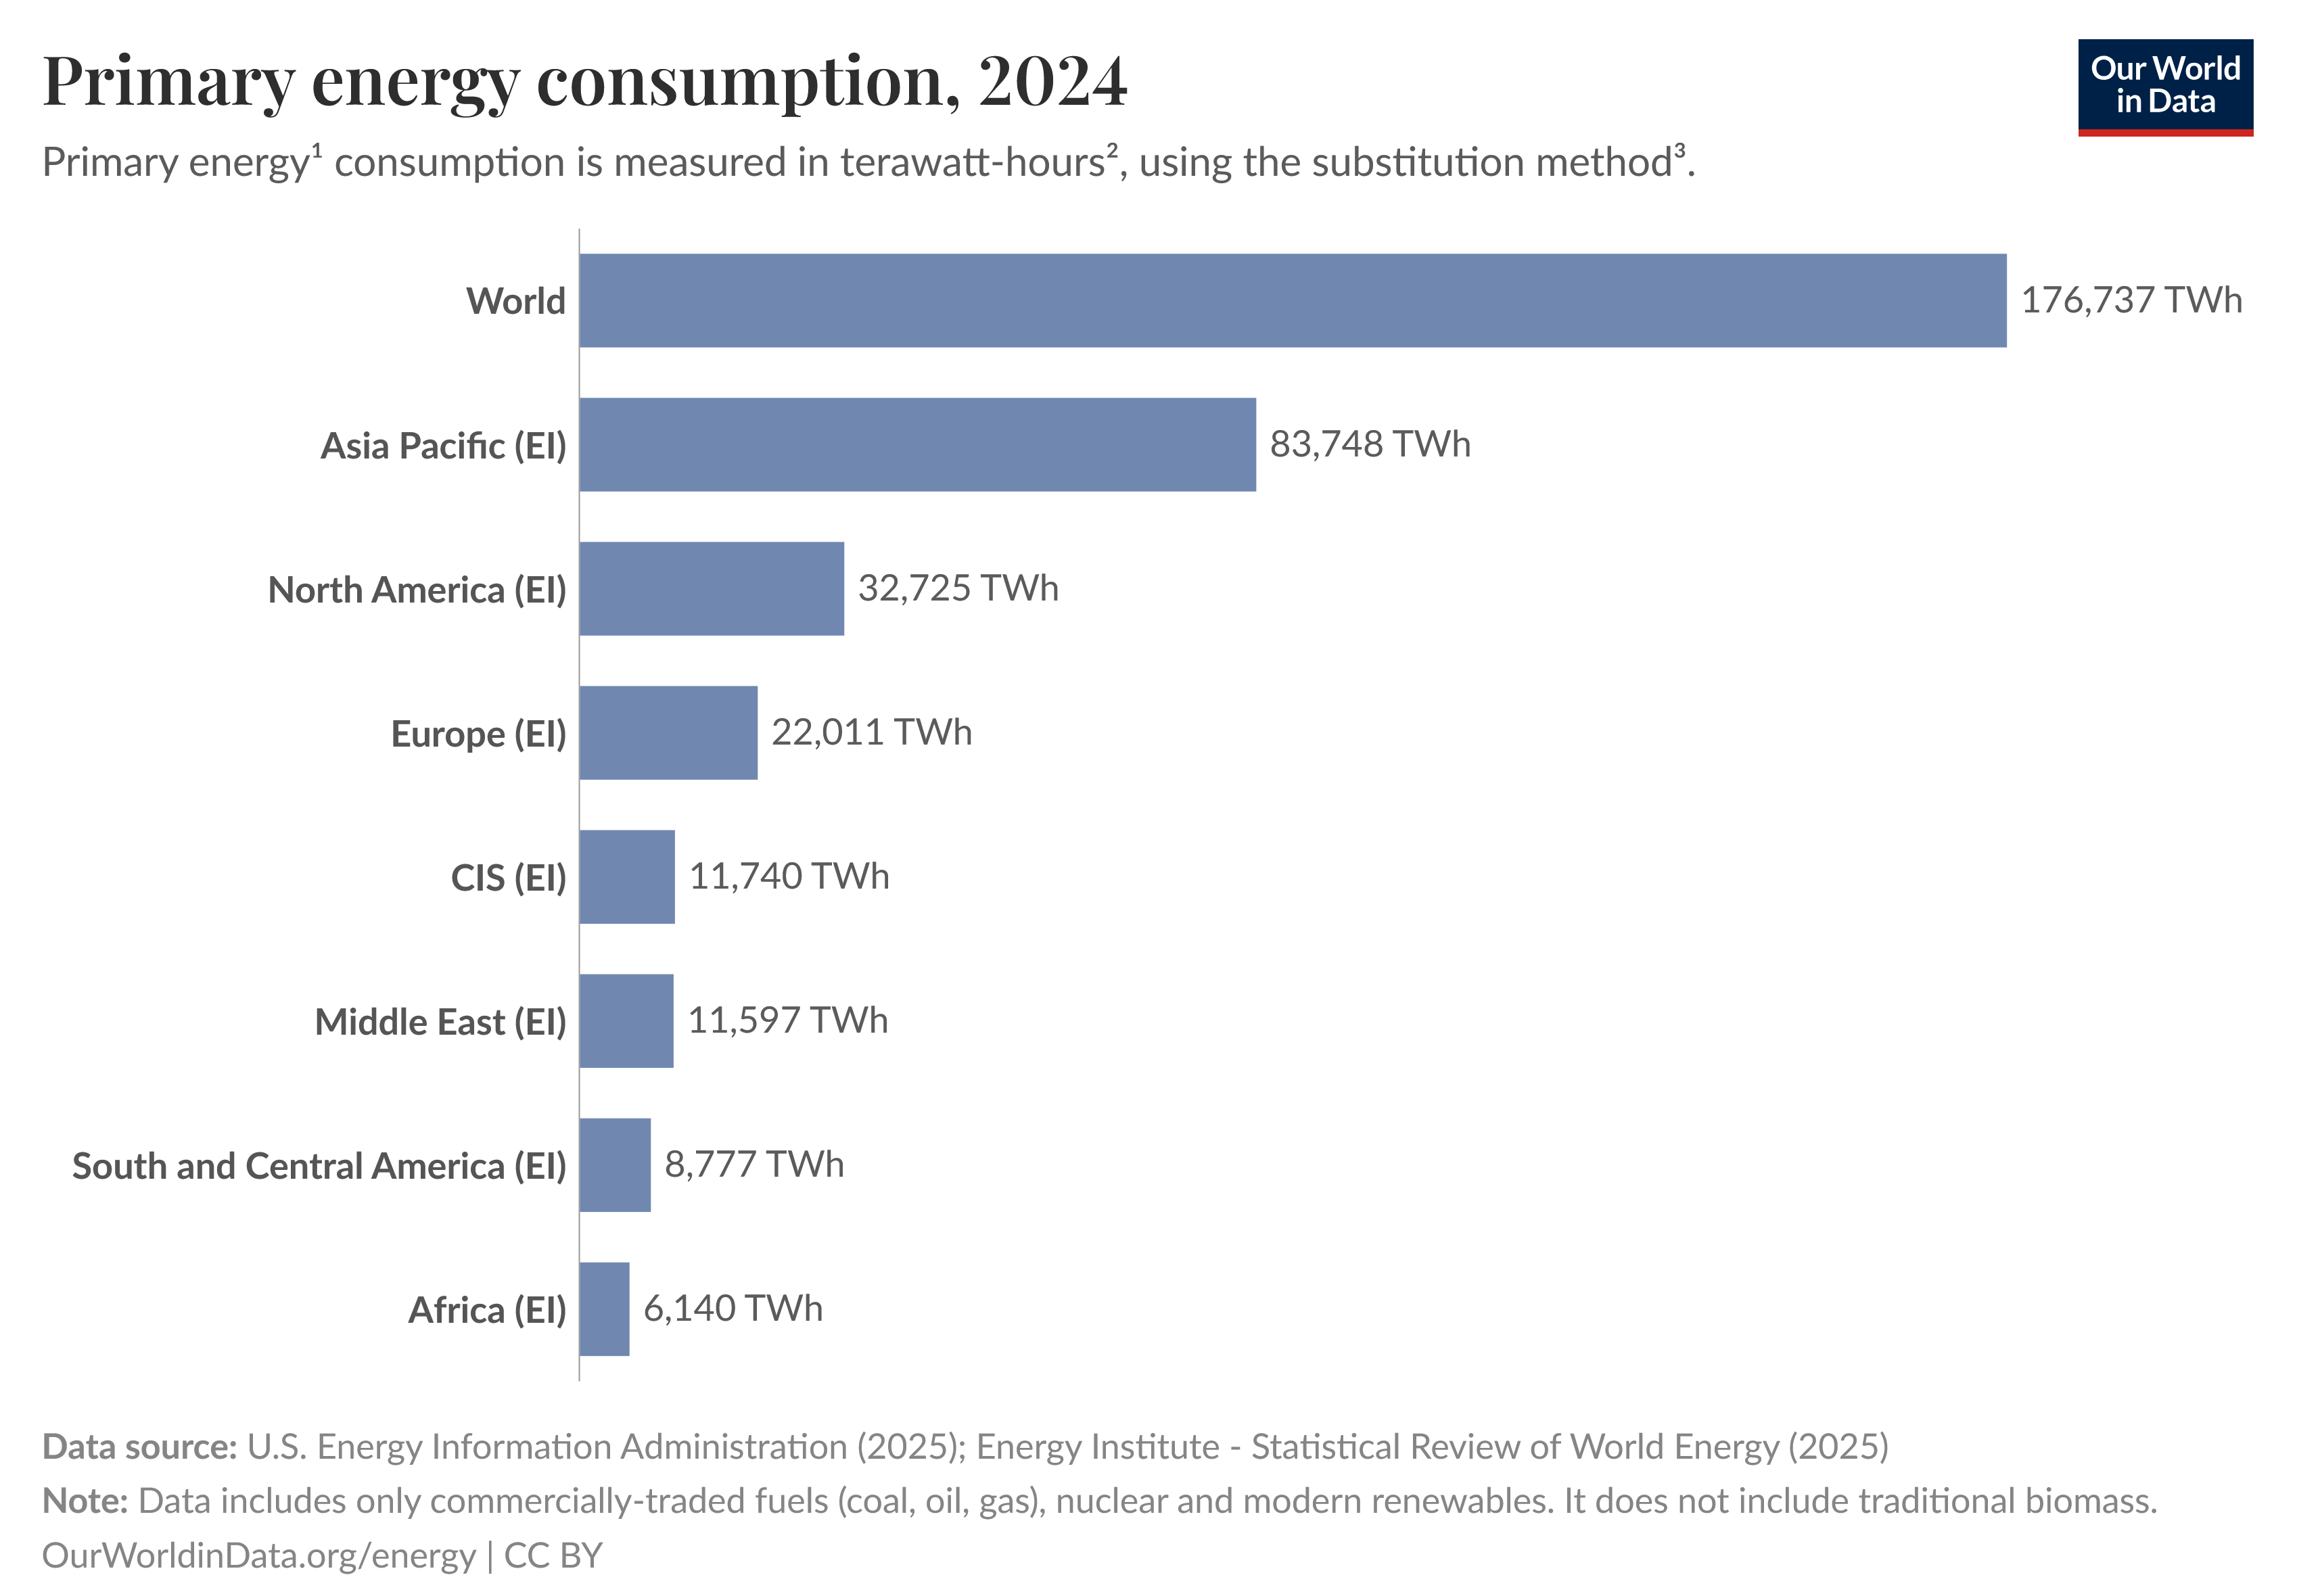
About half of the energy is consumed in Asia-Pacific countries (Fig. 3).
(without traditional biomass)
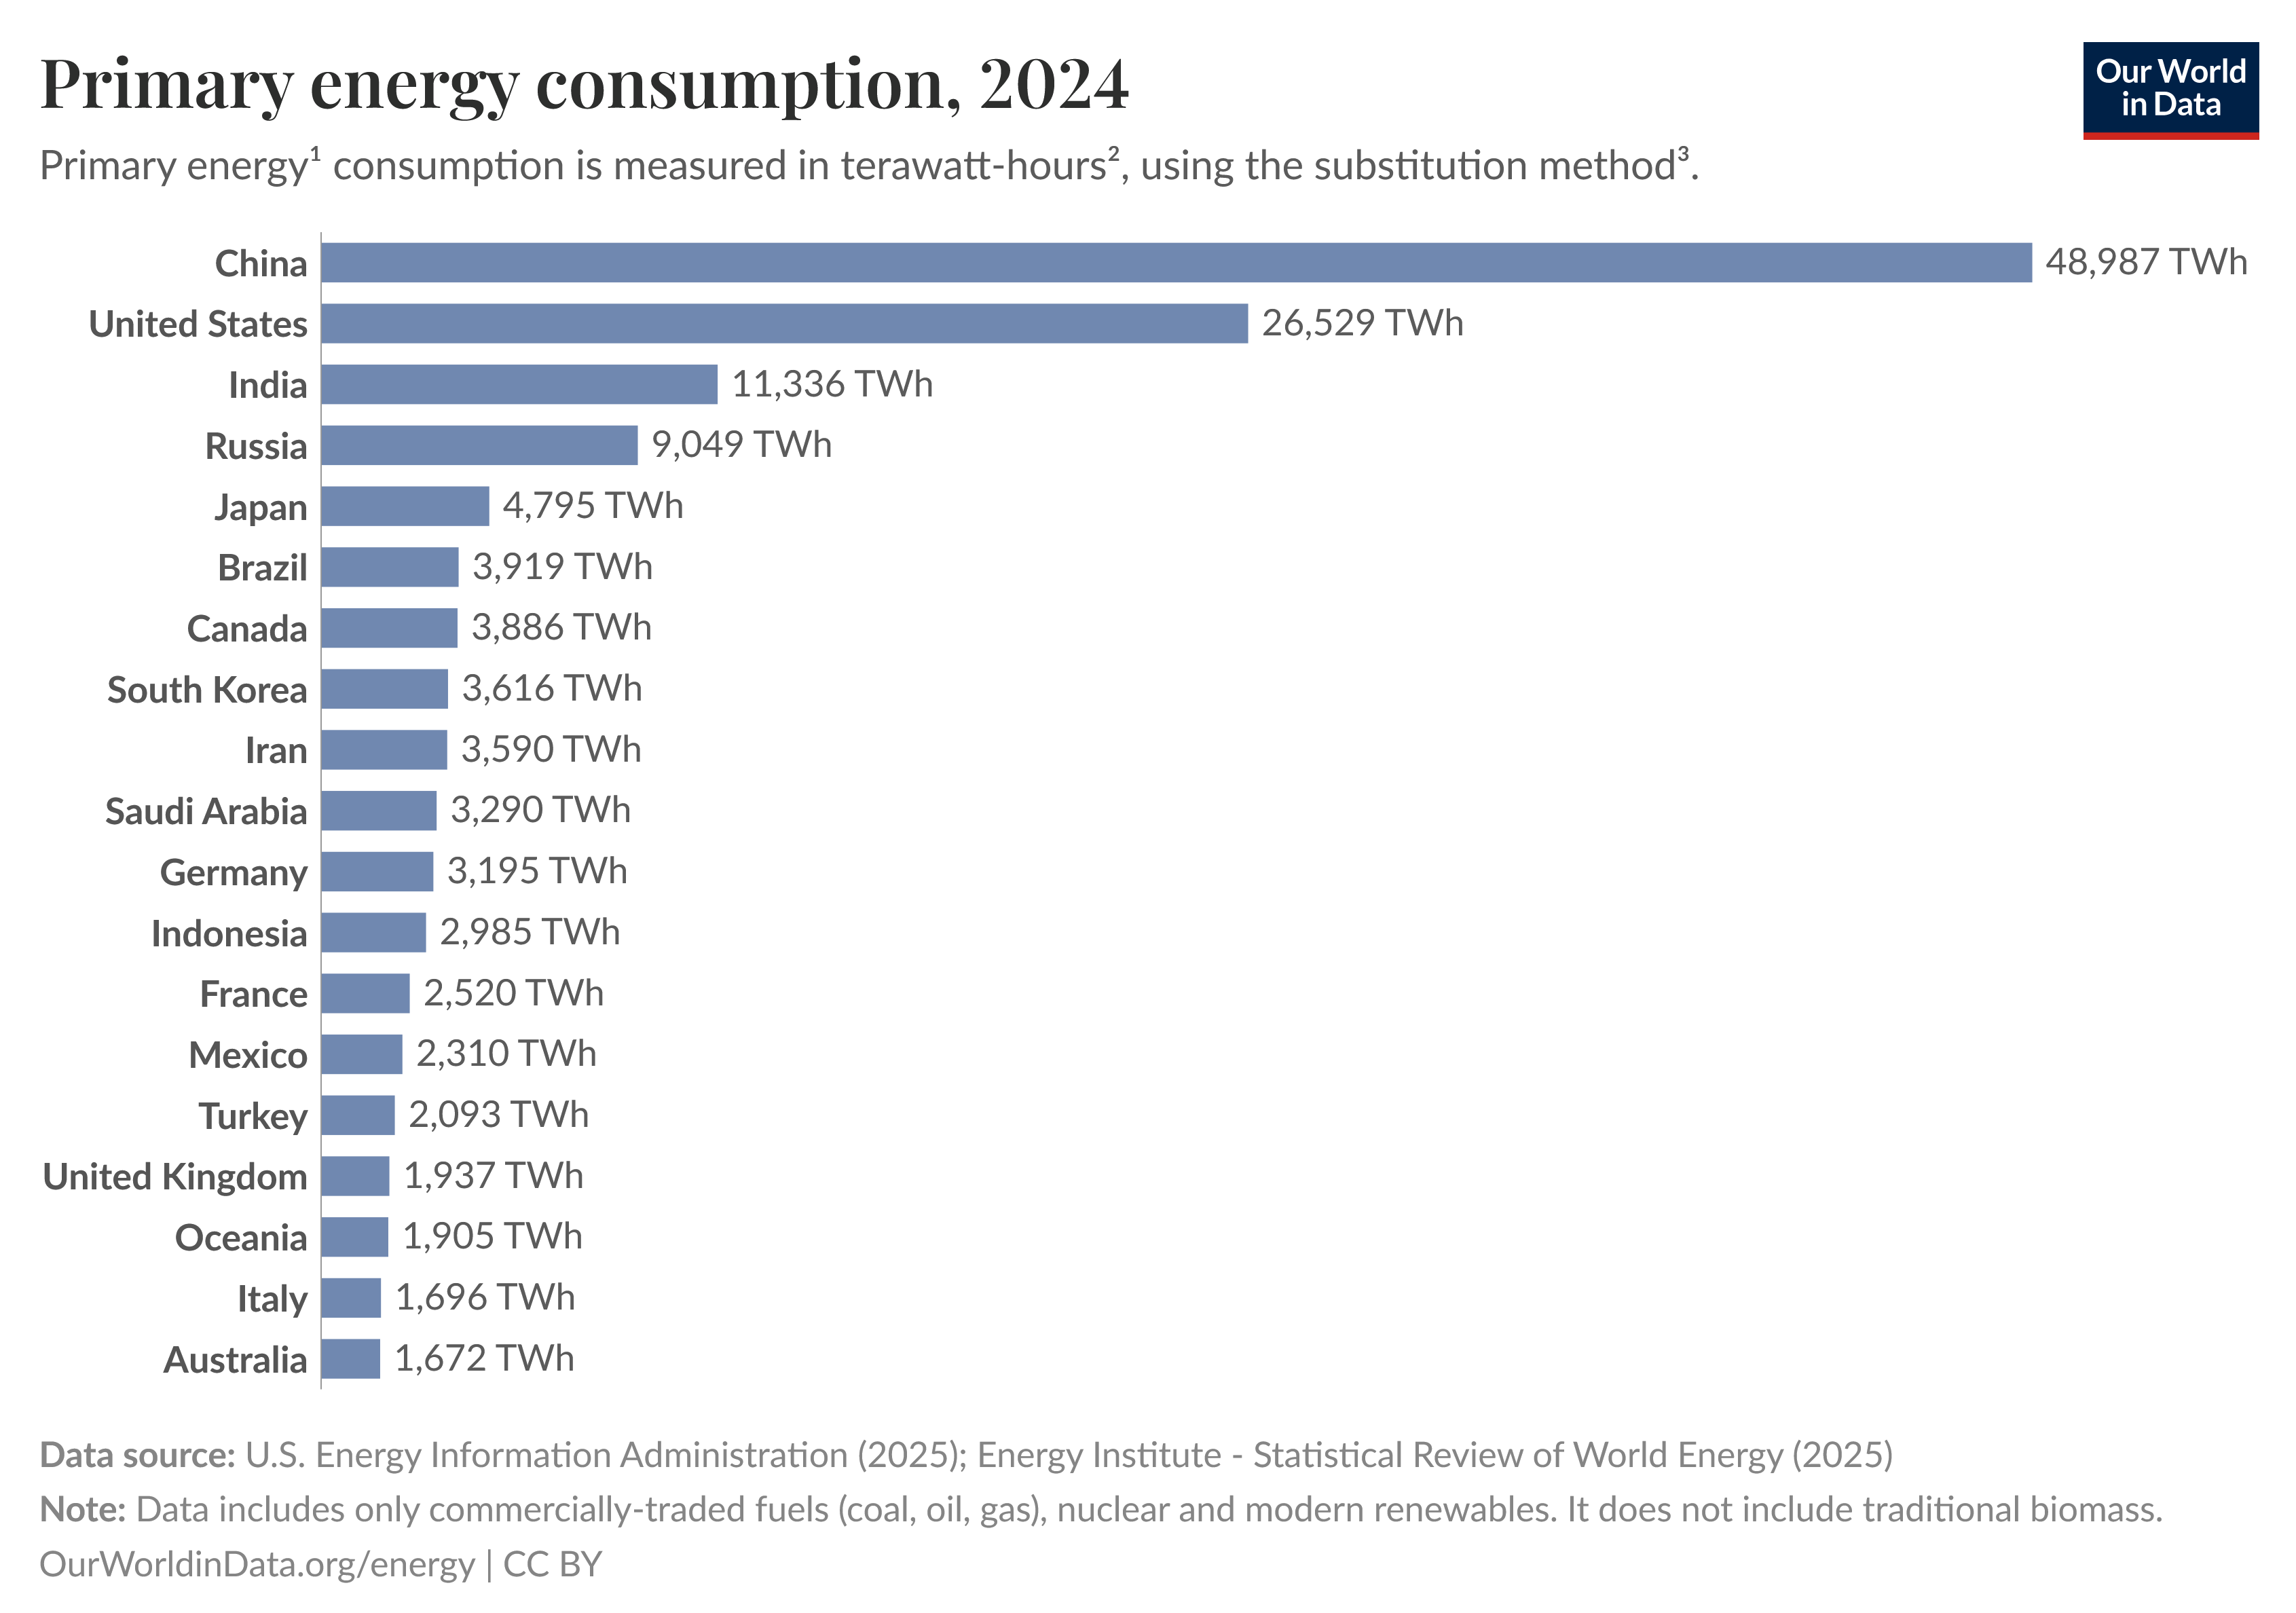
China's energy consumption has surpassed that of the United States by far. China and India together now consume more energy (≈ 60 000 TWh) than North America and Europe combined (≈ 45 000 TWh) (Fig 4):
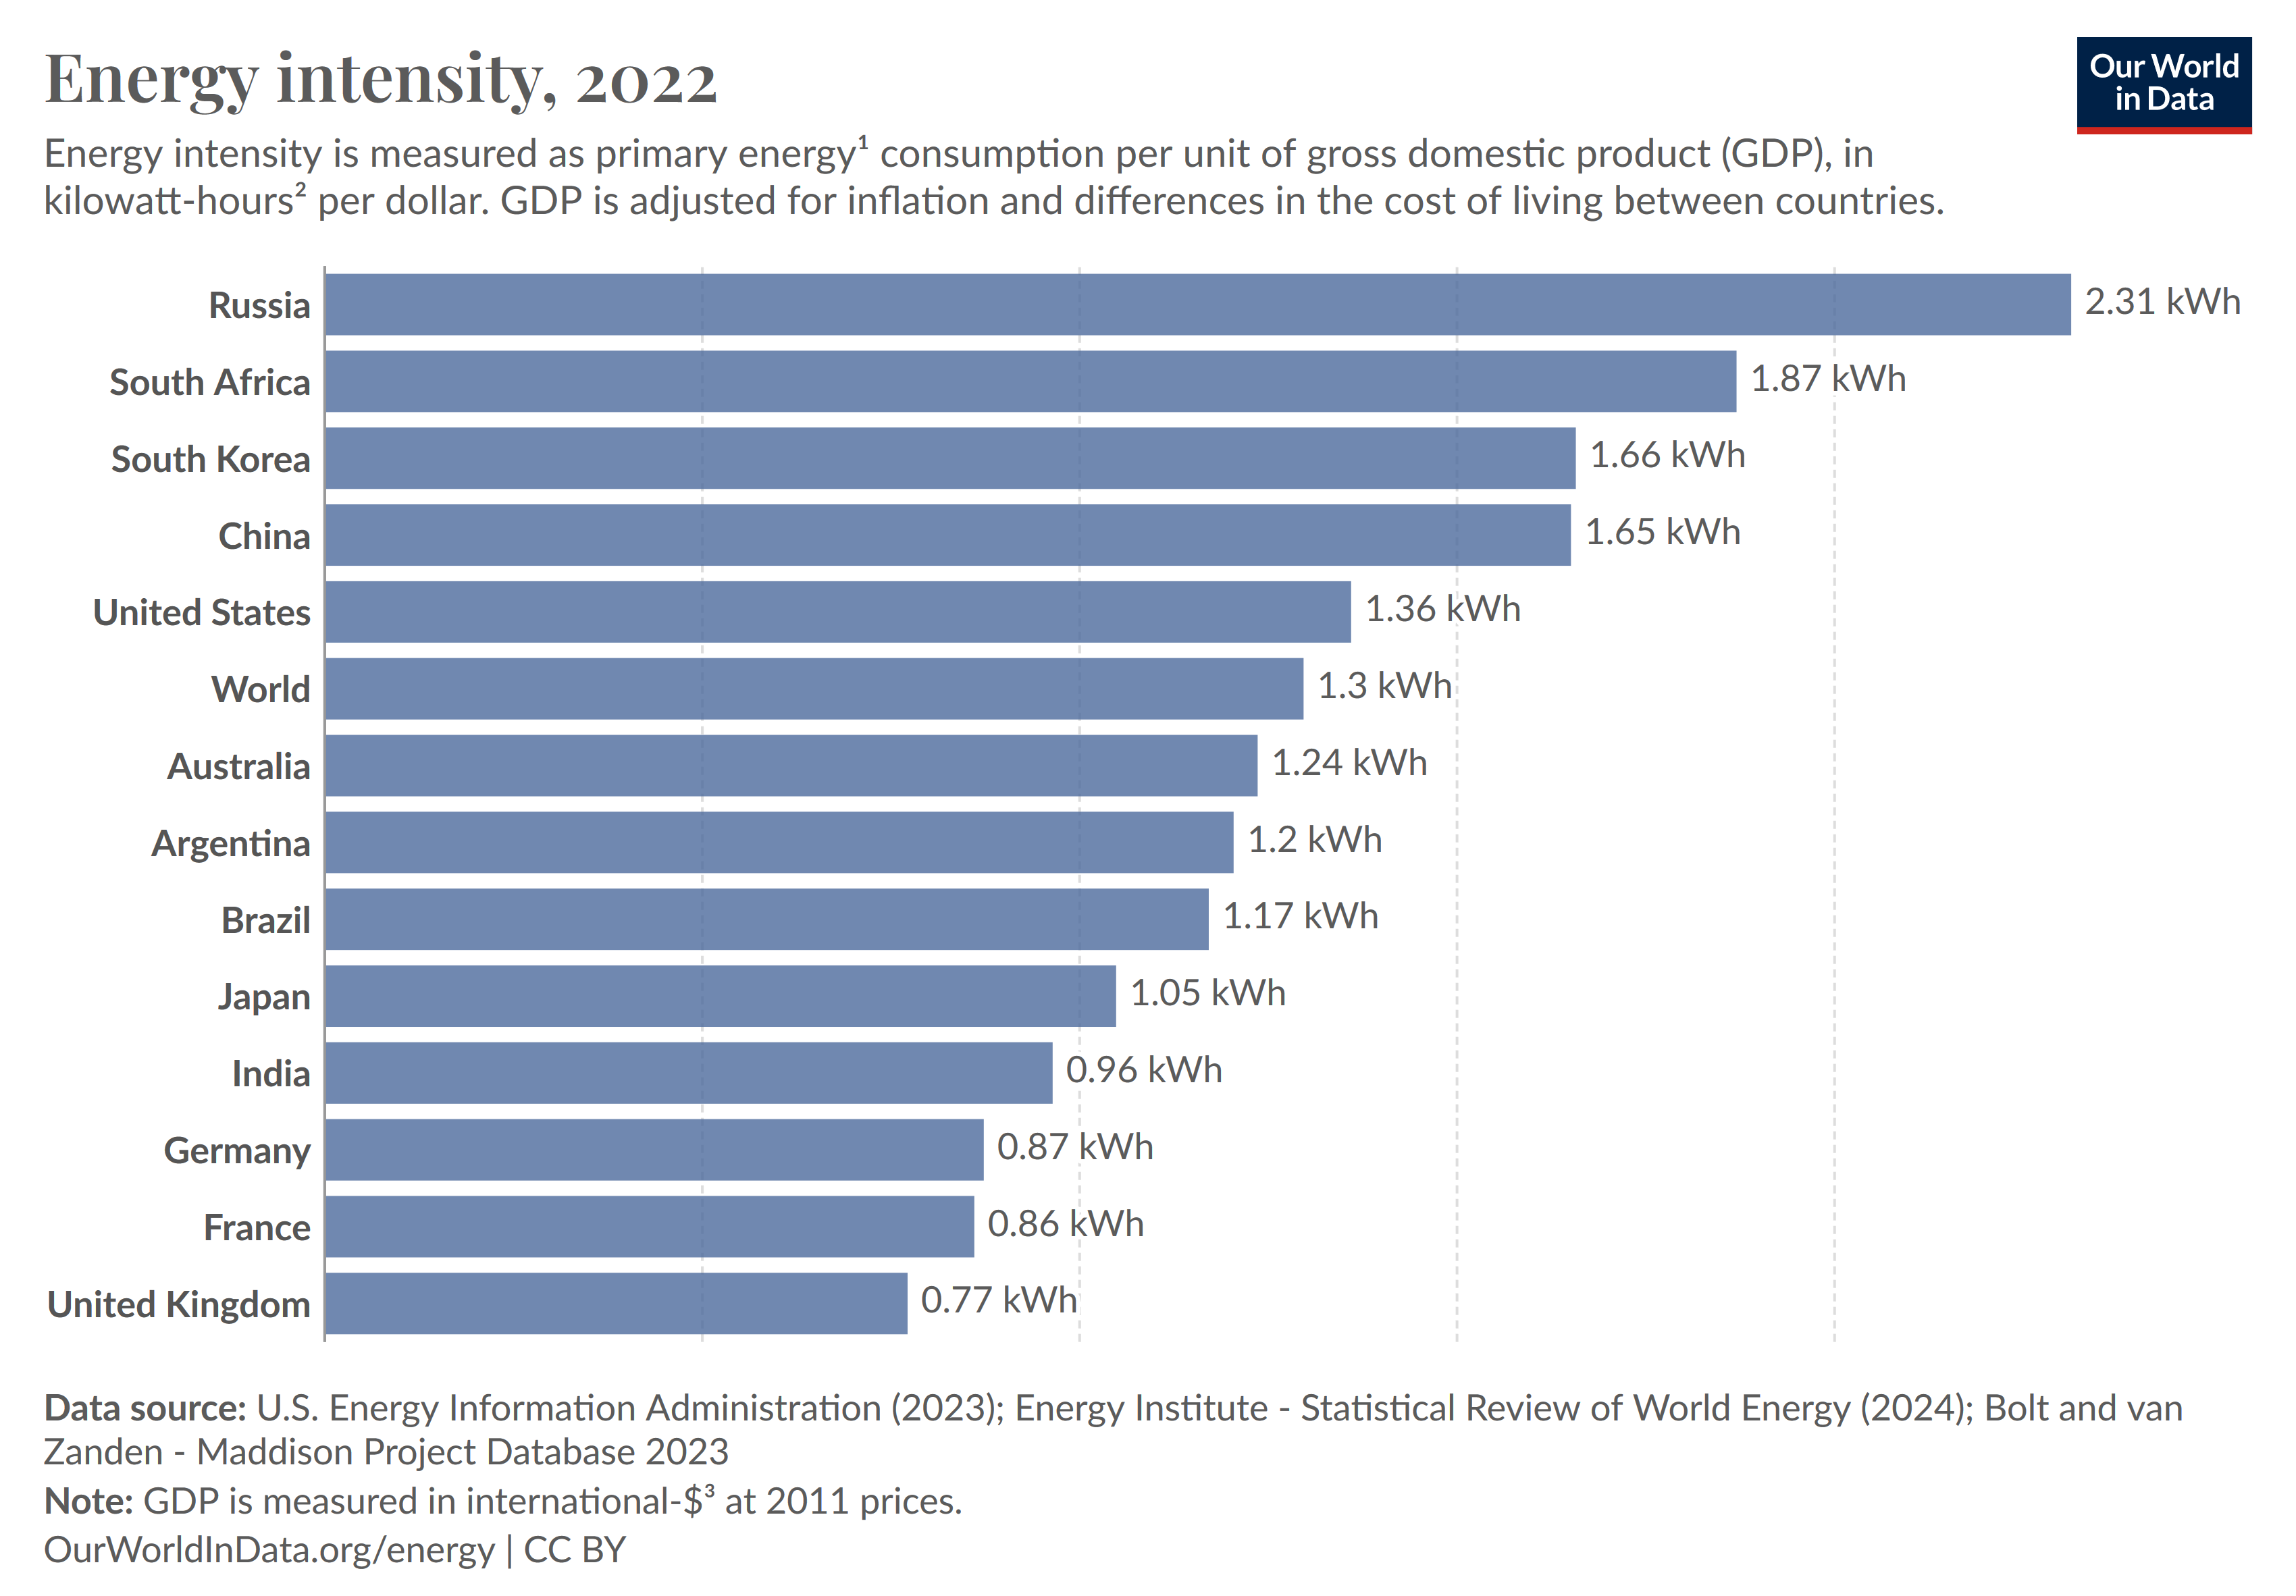
Energy-poor European countries are less energy intense, as indicated by low energy consumption relative to GDP (Fig. 5). North America is close to the world average, while energy-rich Russia or production rather than service-oriented economies like China need not or cannot care so much about energy intensity.
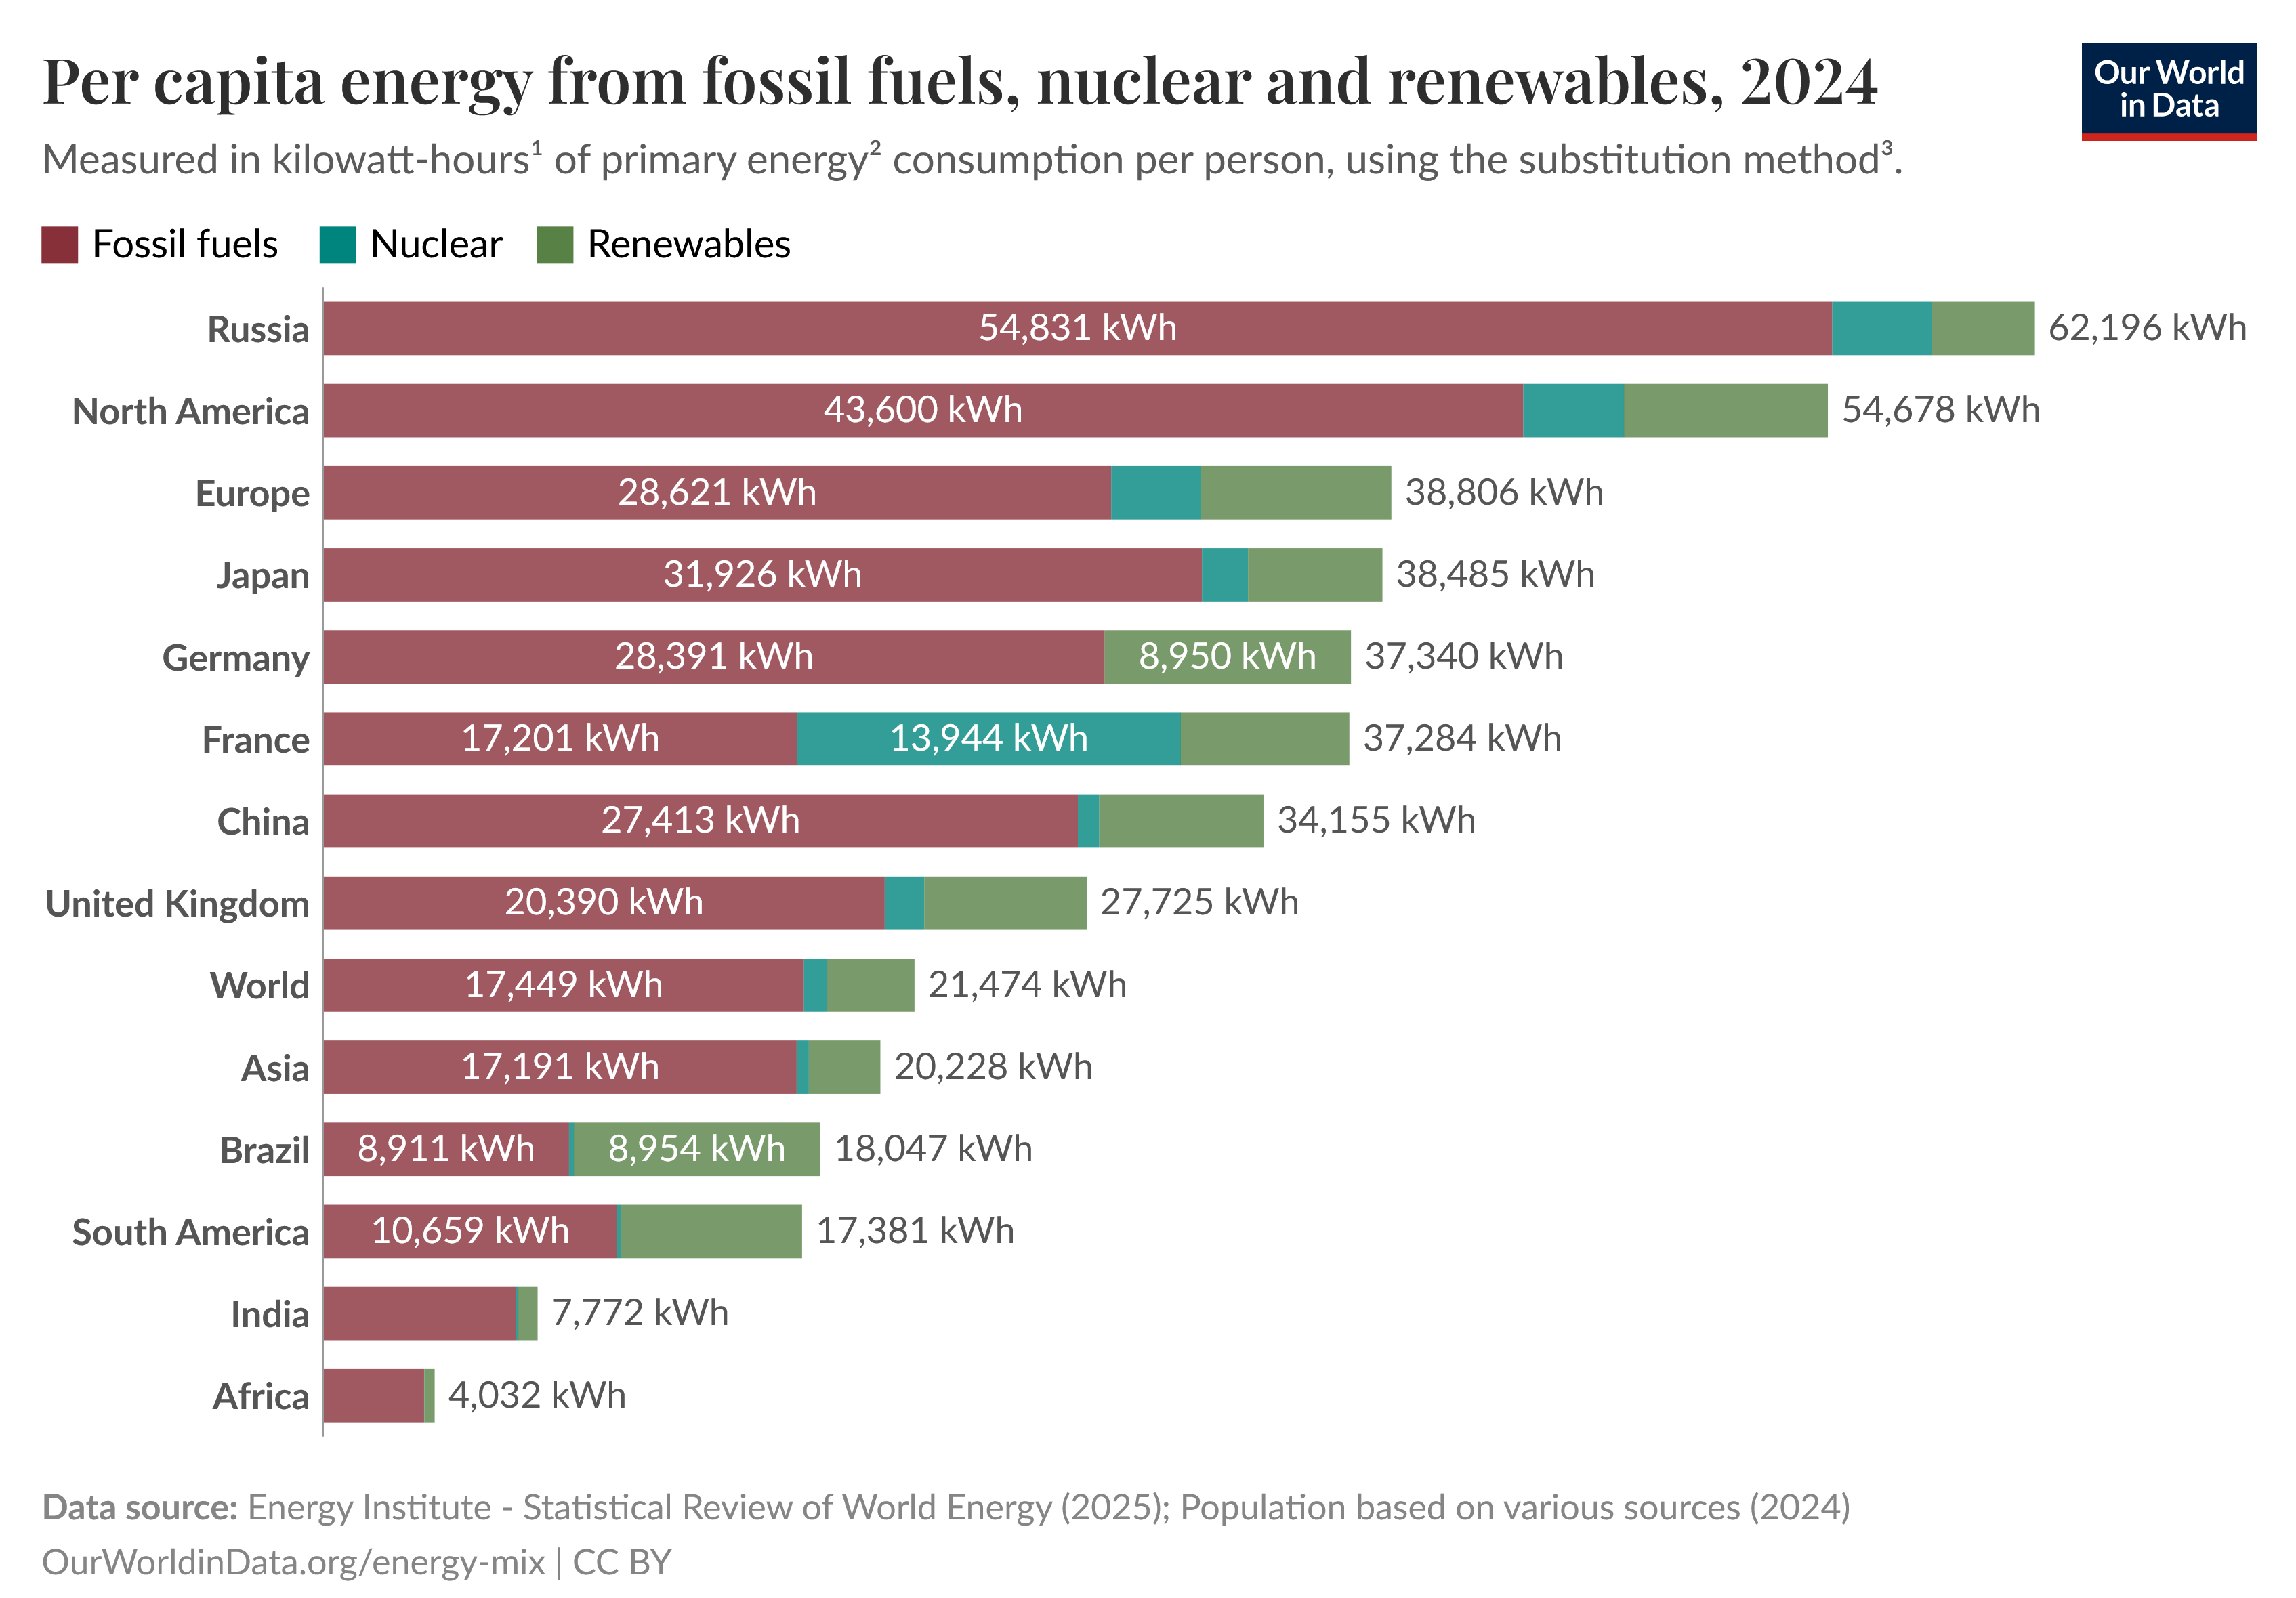
If we look at per capita consumption, the picture is somewhat different, as countries such as China or India consume enormous amounts of energy in absolute terms, but also have huge populations with still relatively modest living standards (Fig. 6).
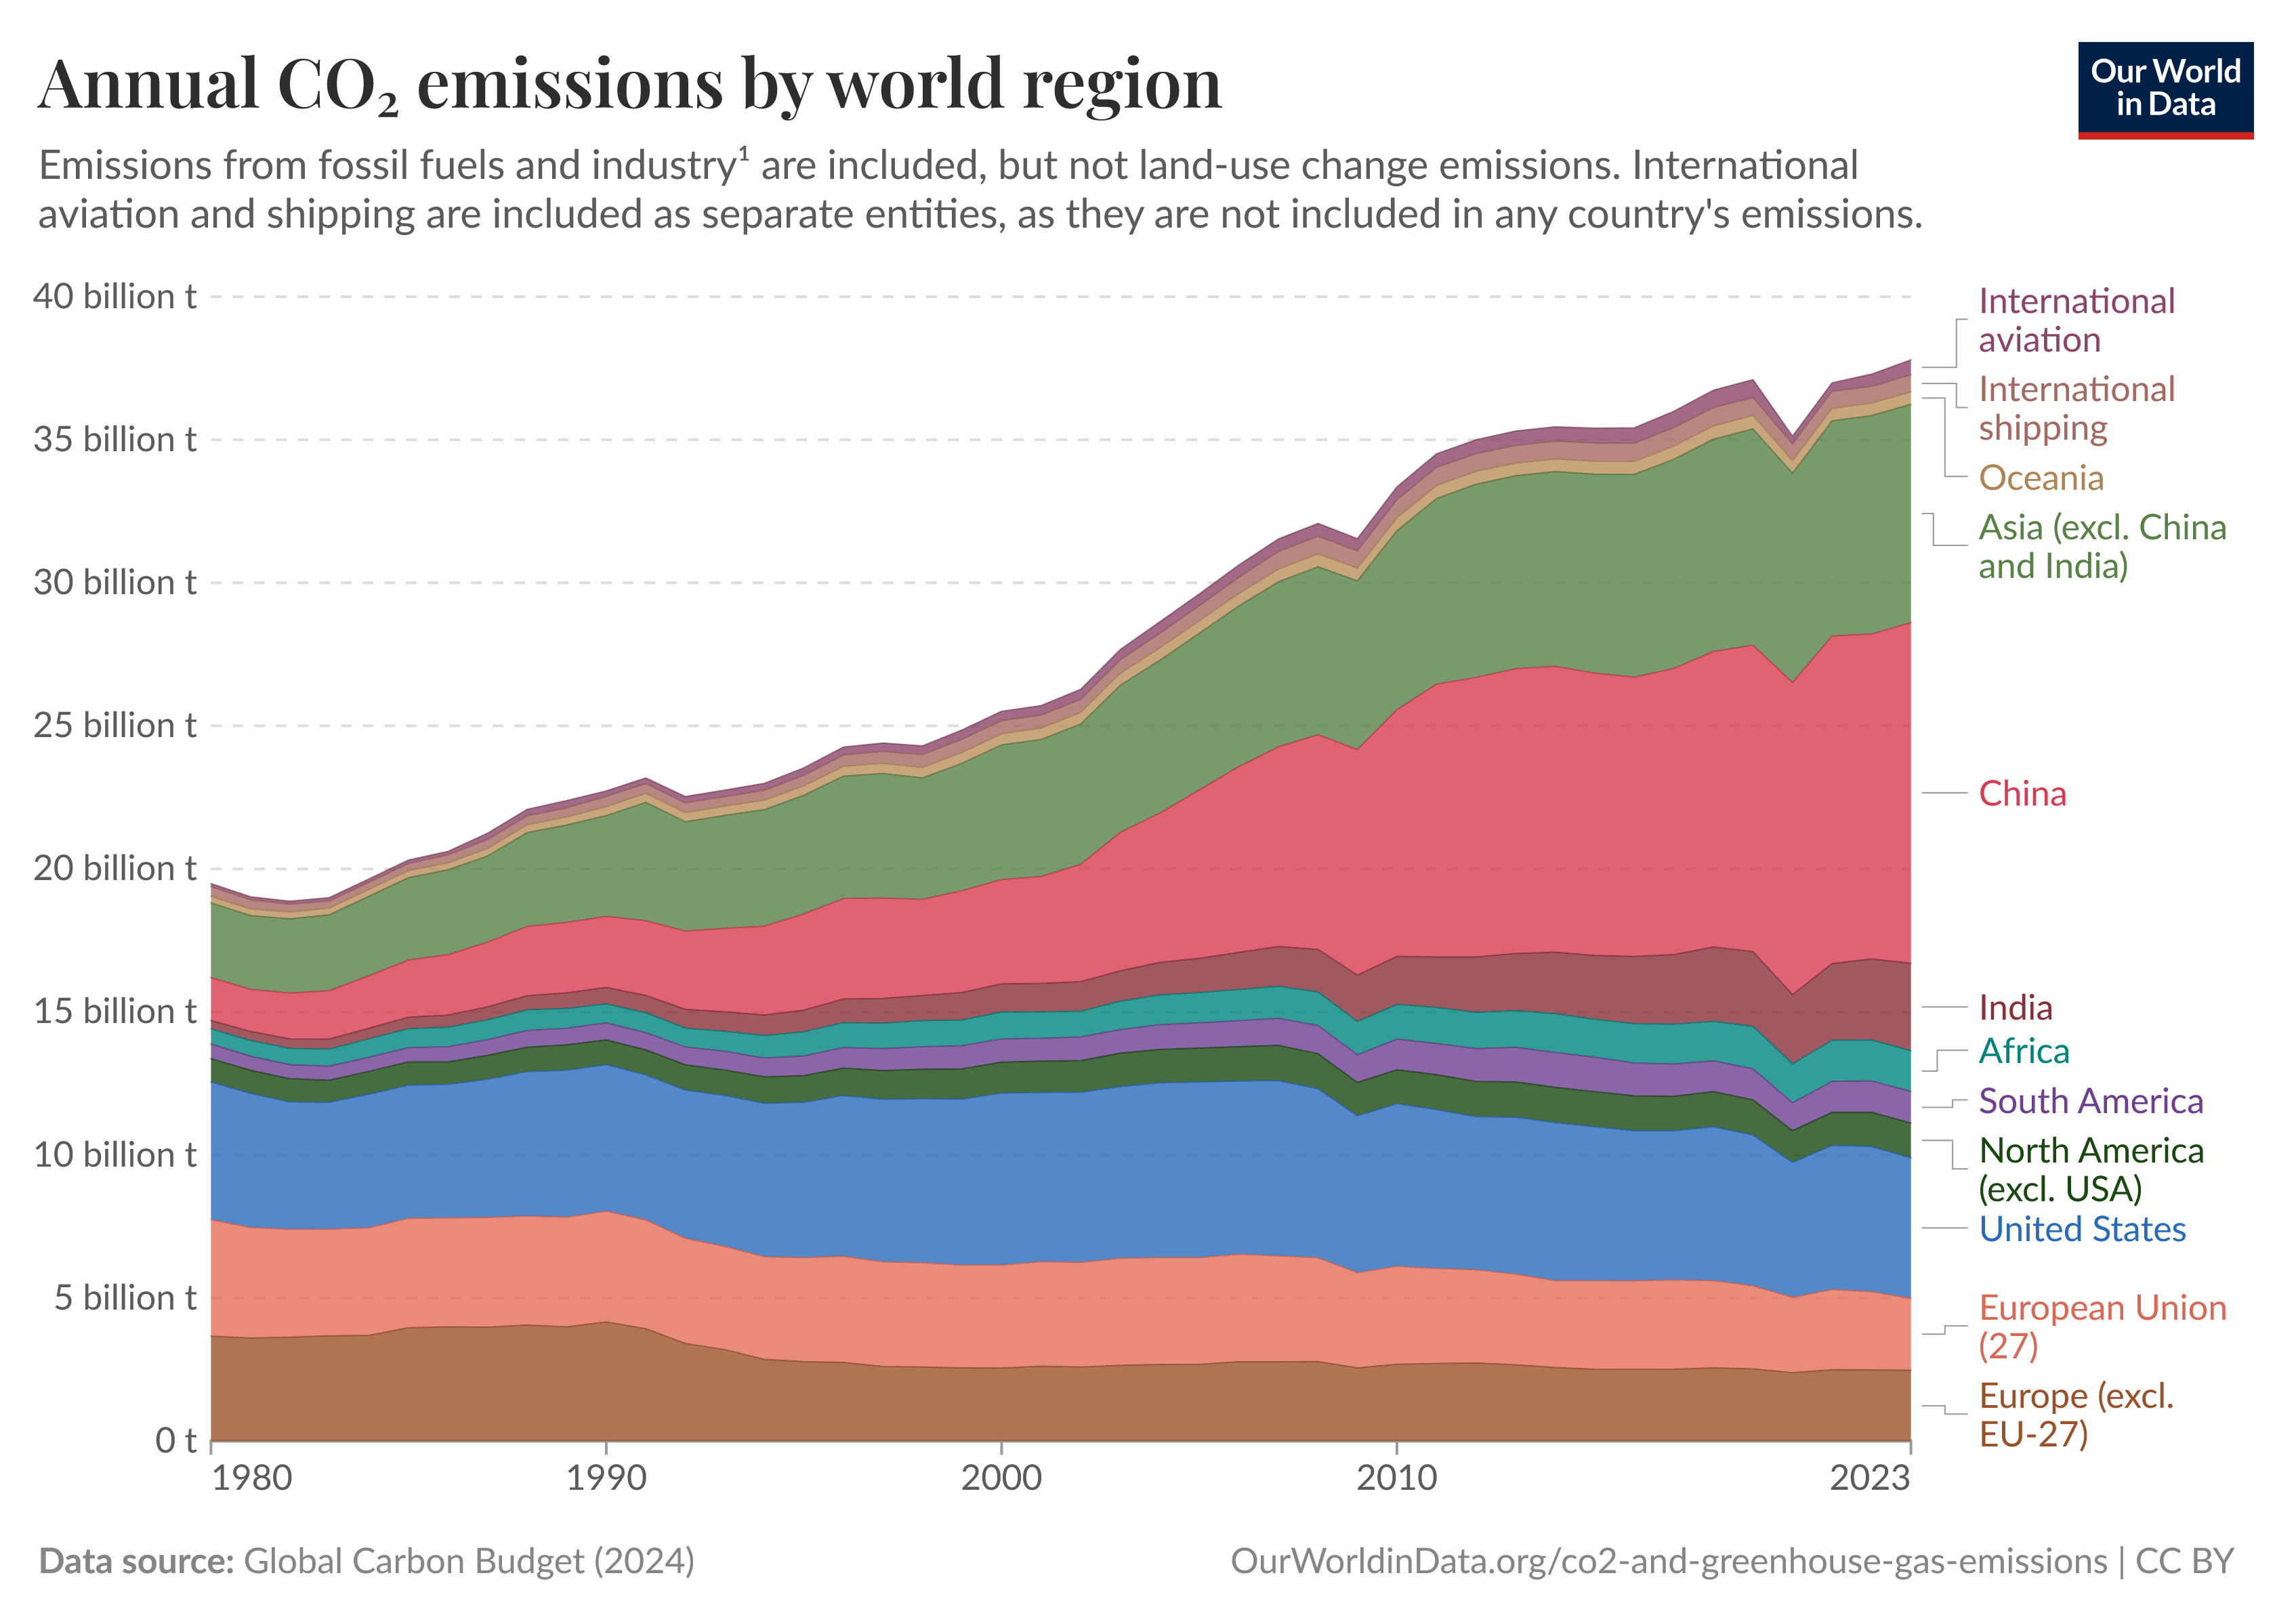
We expect living standards in the Global South to rise further as they did in the past, perhaps reaching per capita levels similar to those in Europe by mid to end of this century. In the past, all world regions with major economic growth saw a steep upward trend in CO2 emissions (Fig. 7). There is no reason why this trend would stop.
Energy Sources
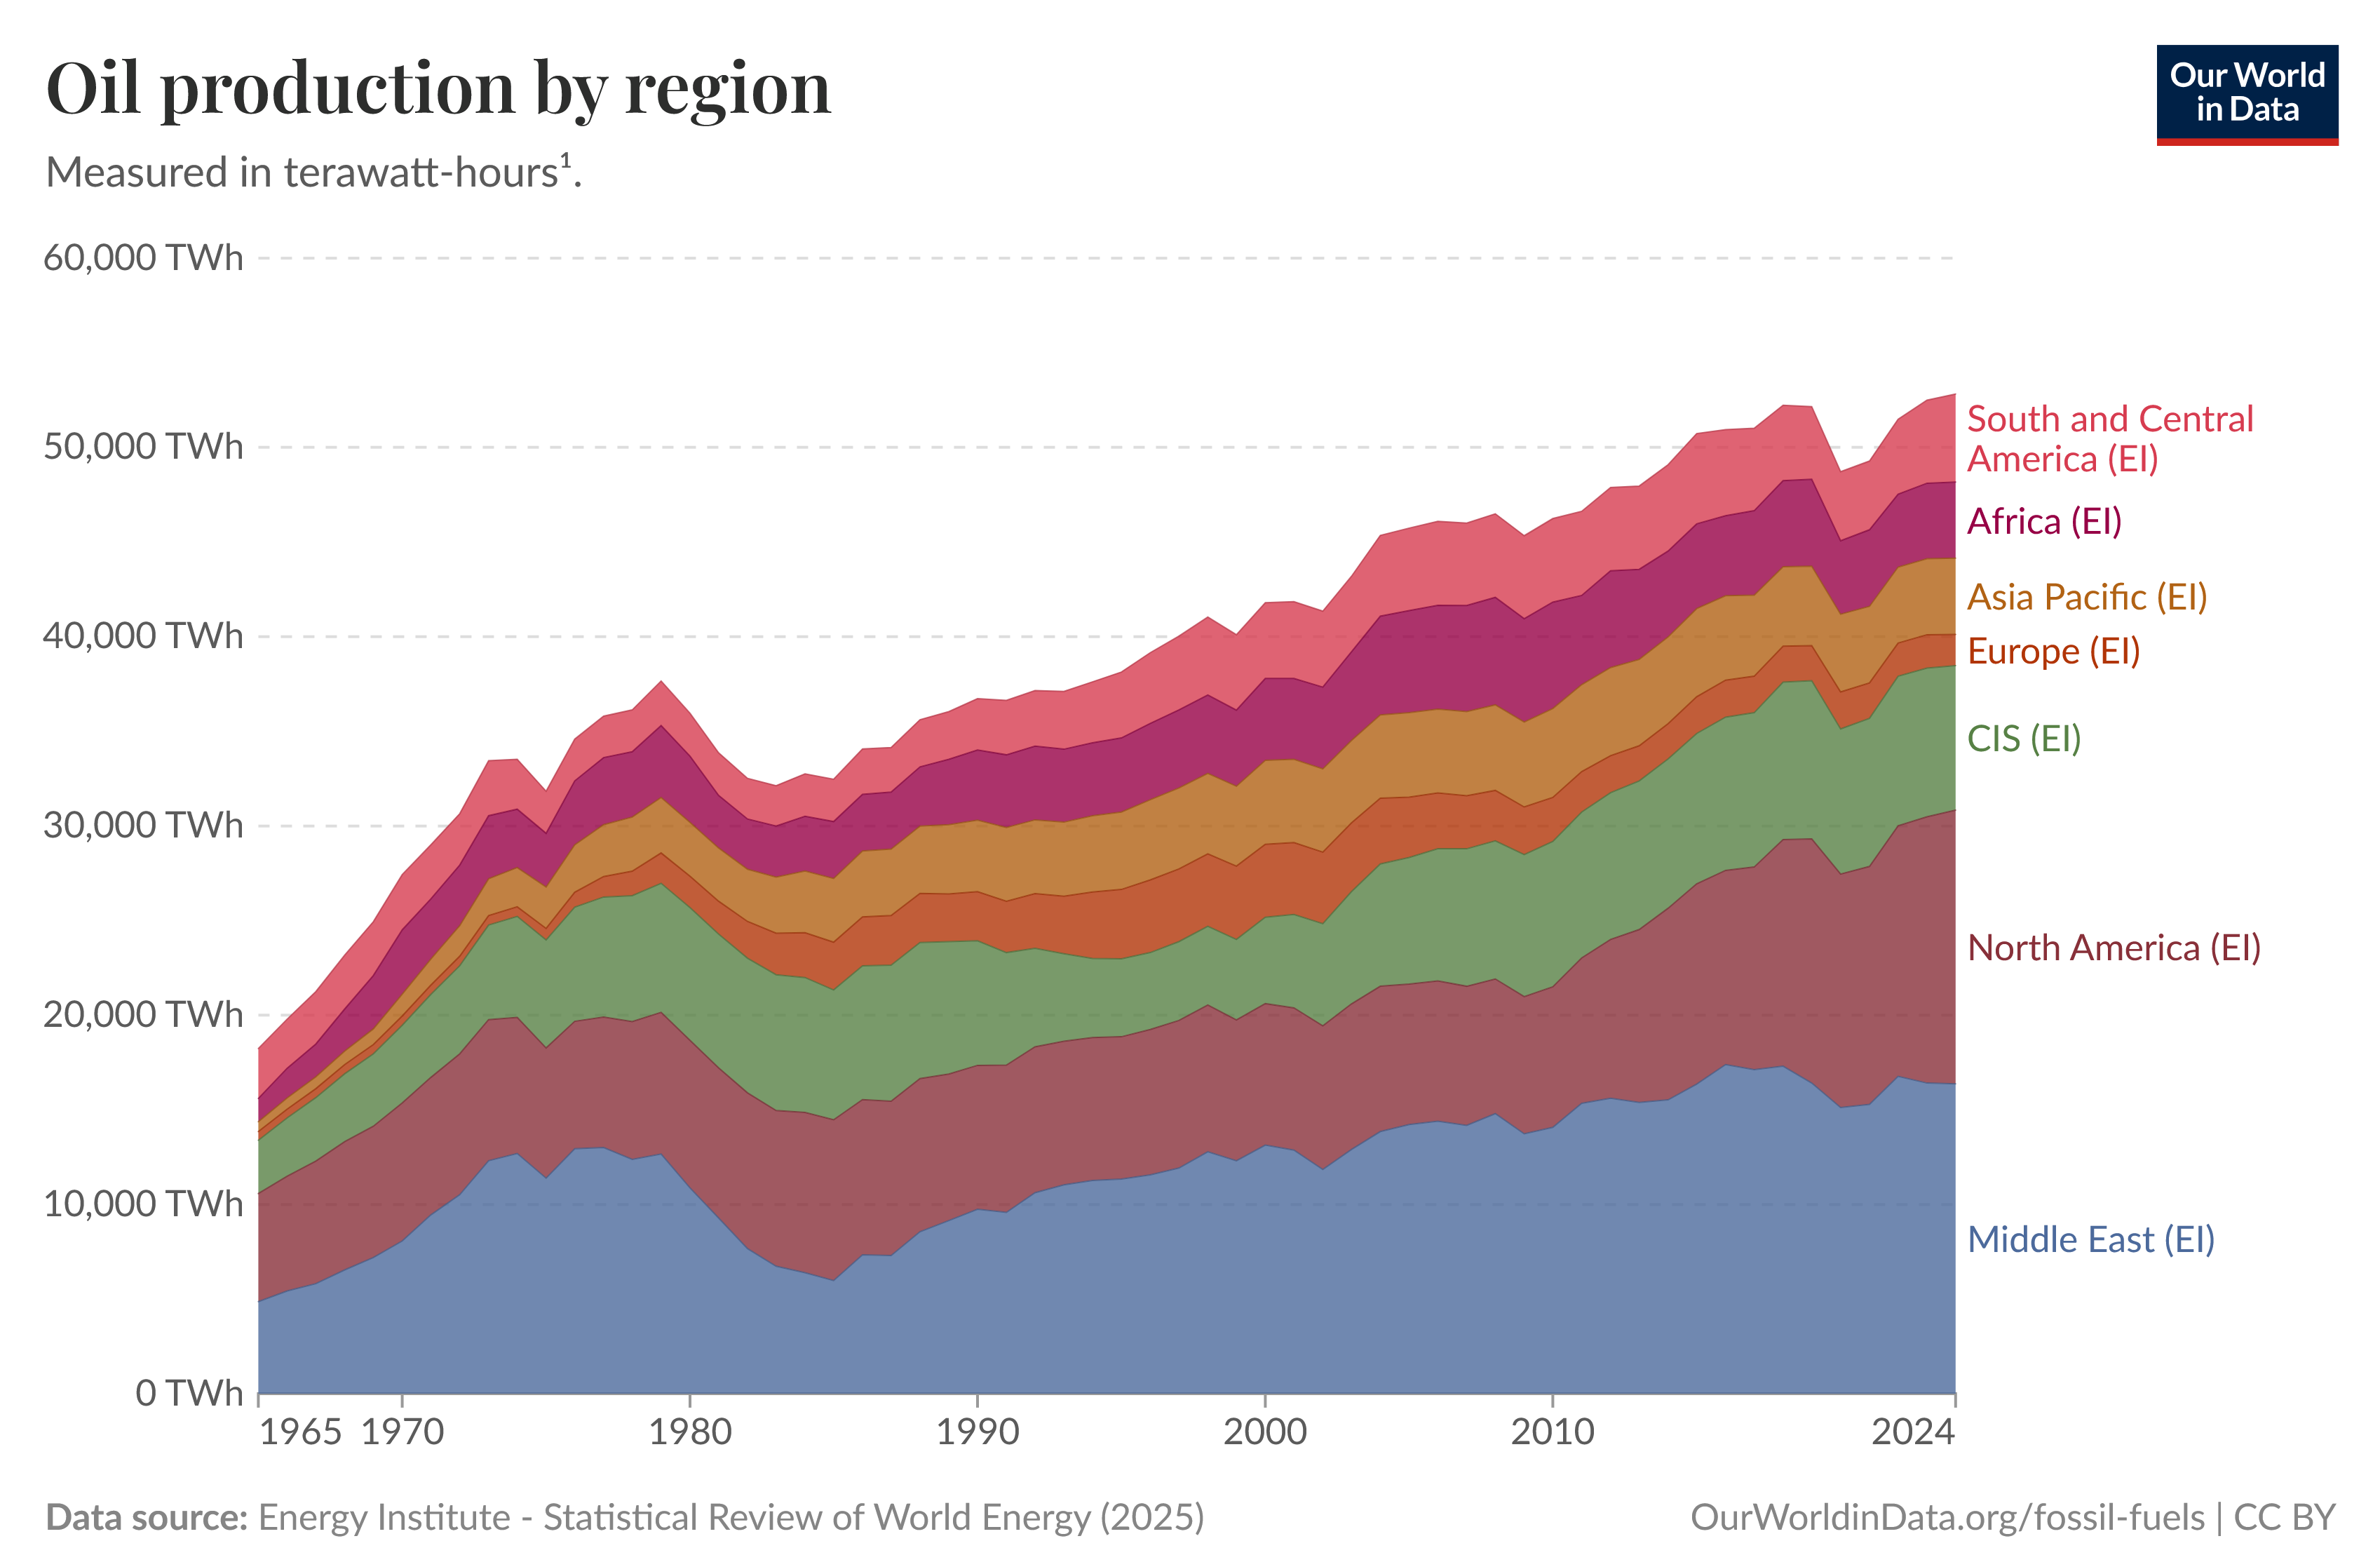
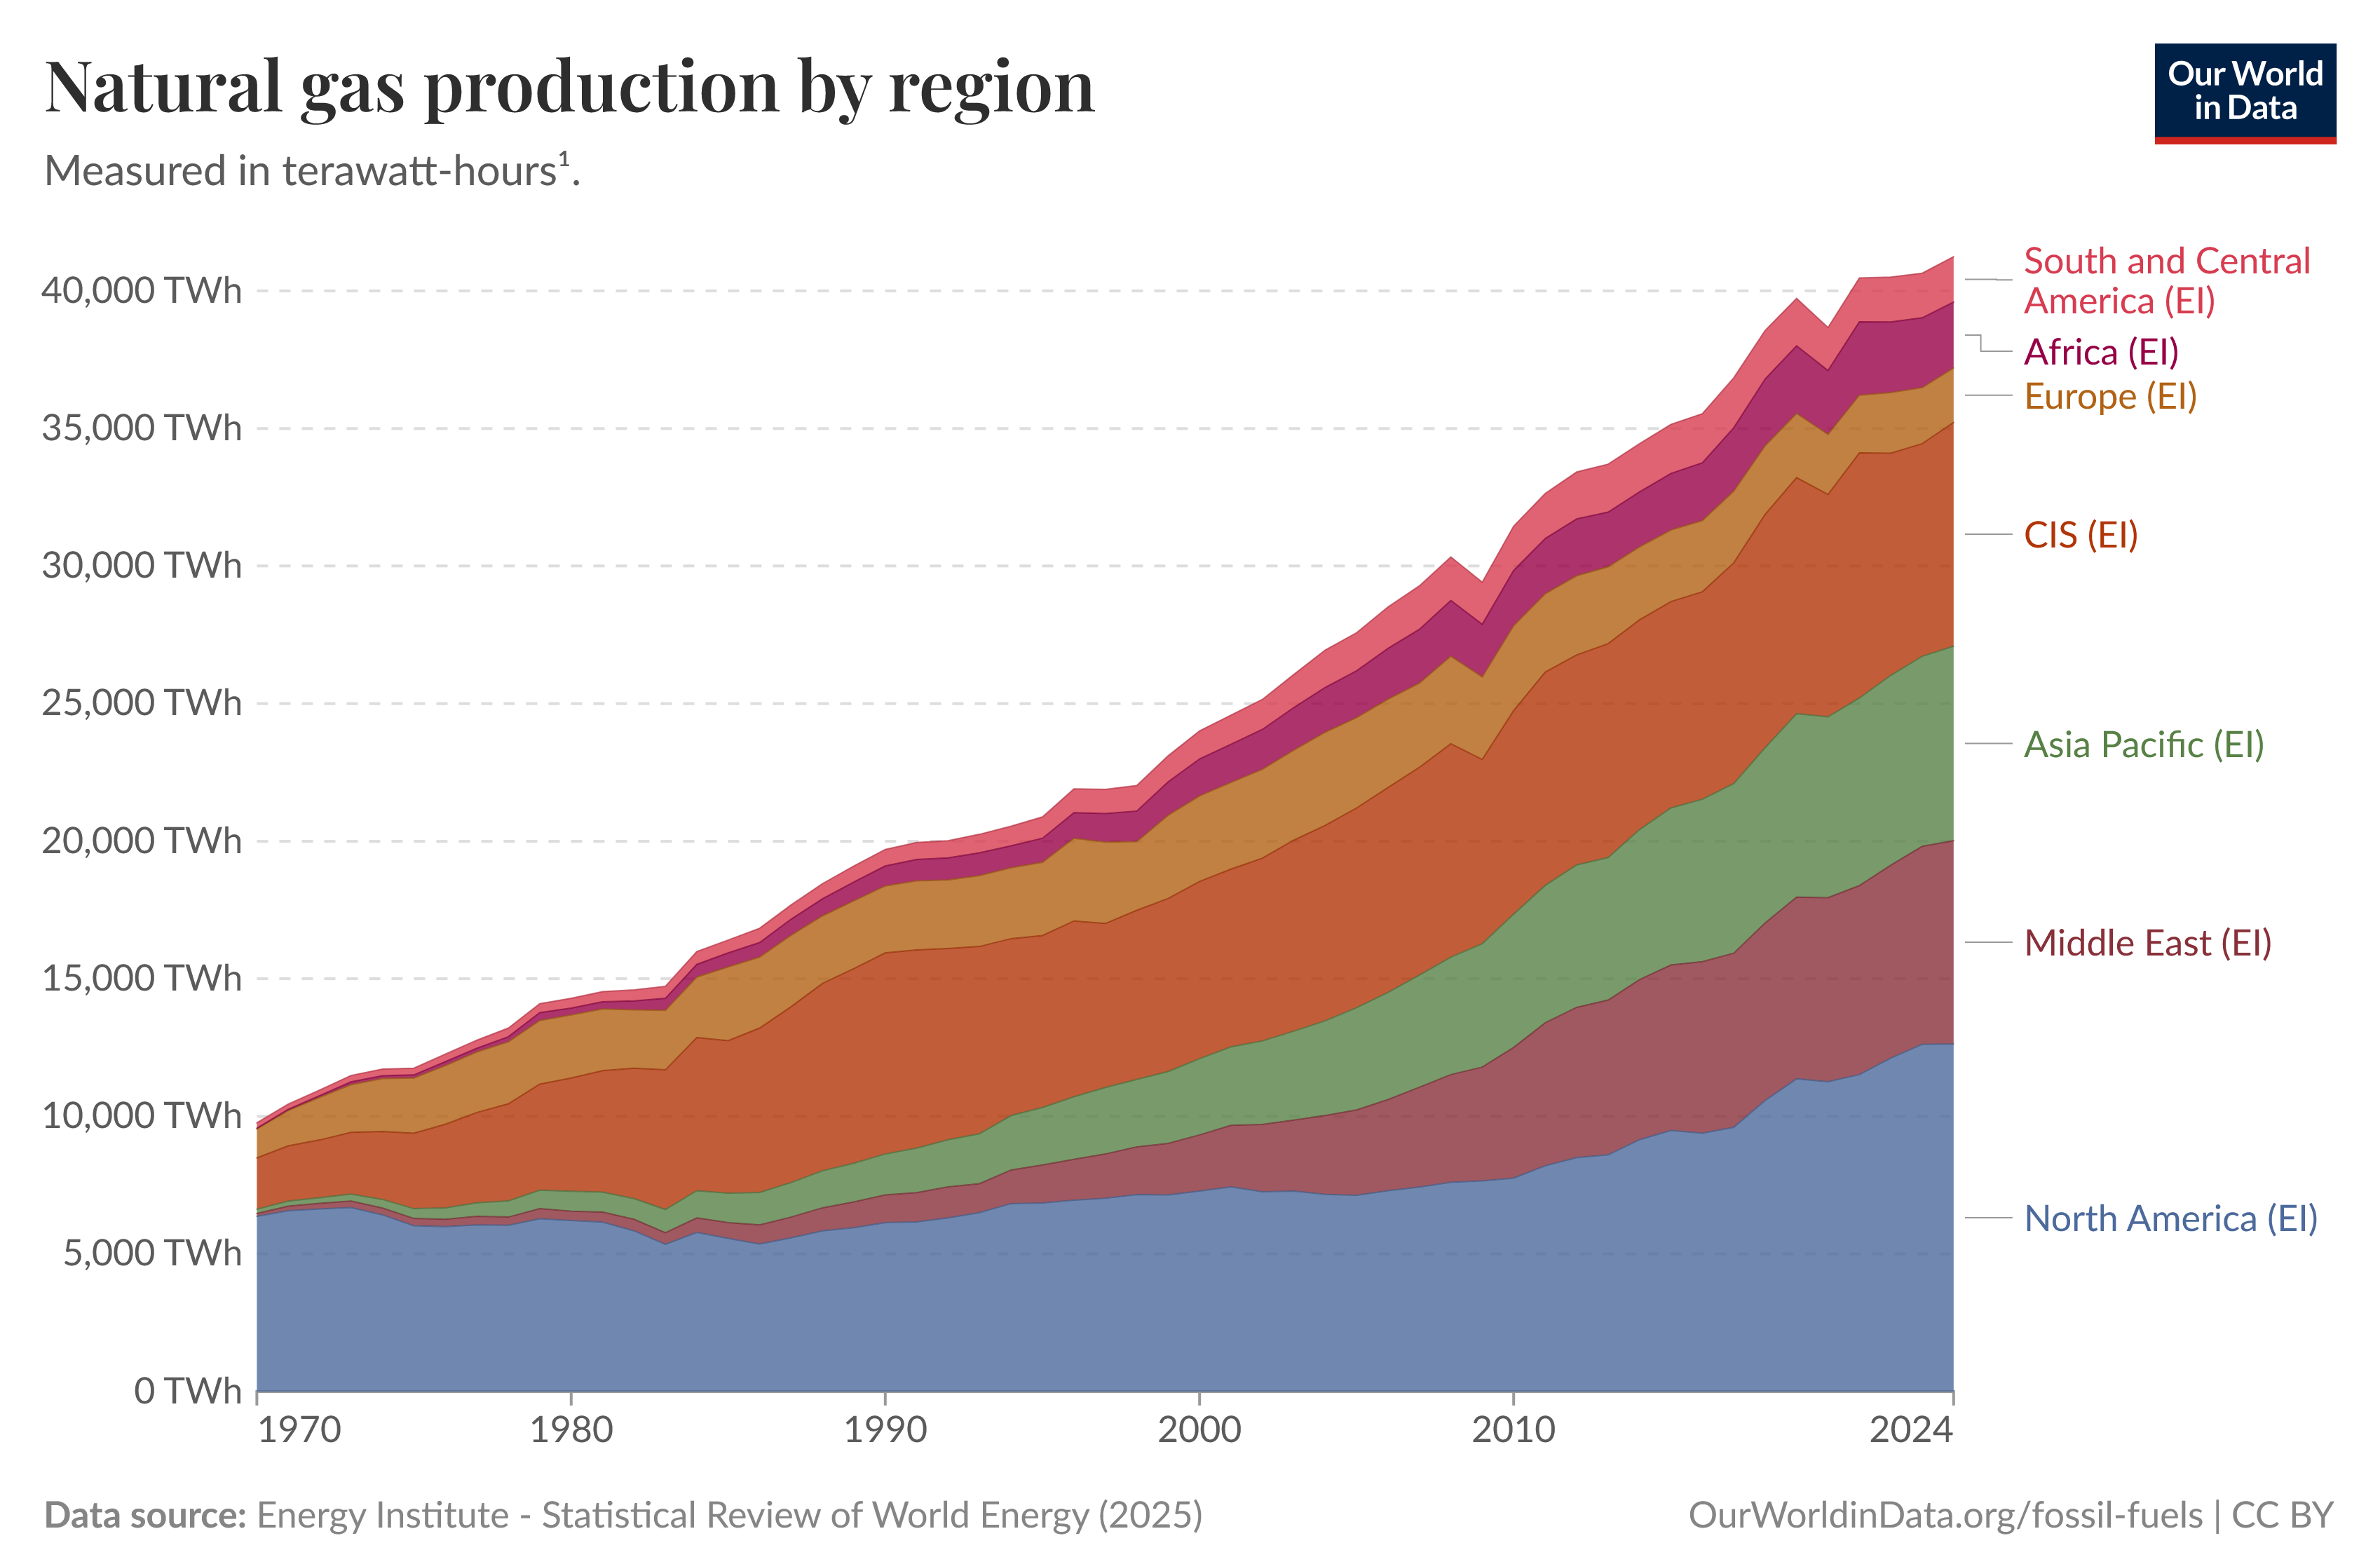
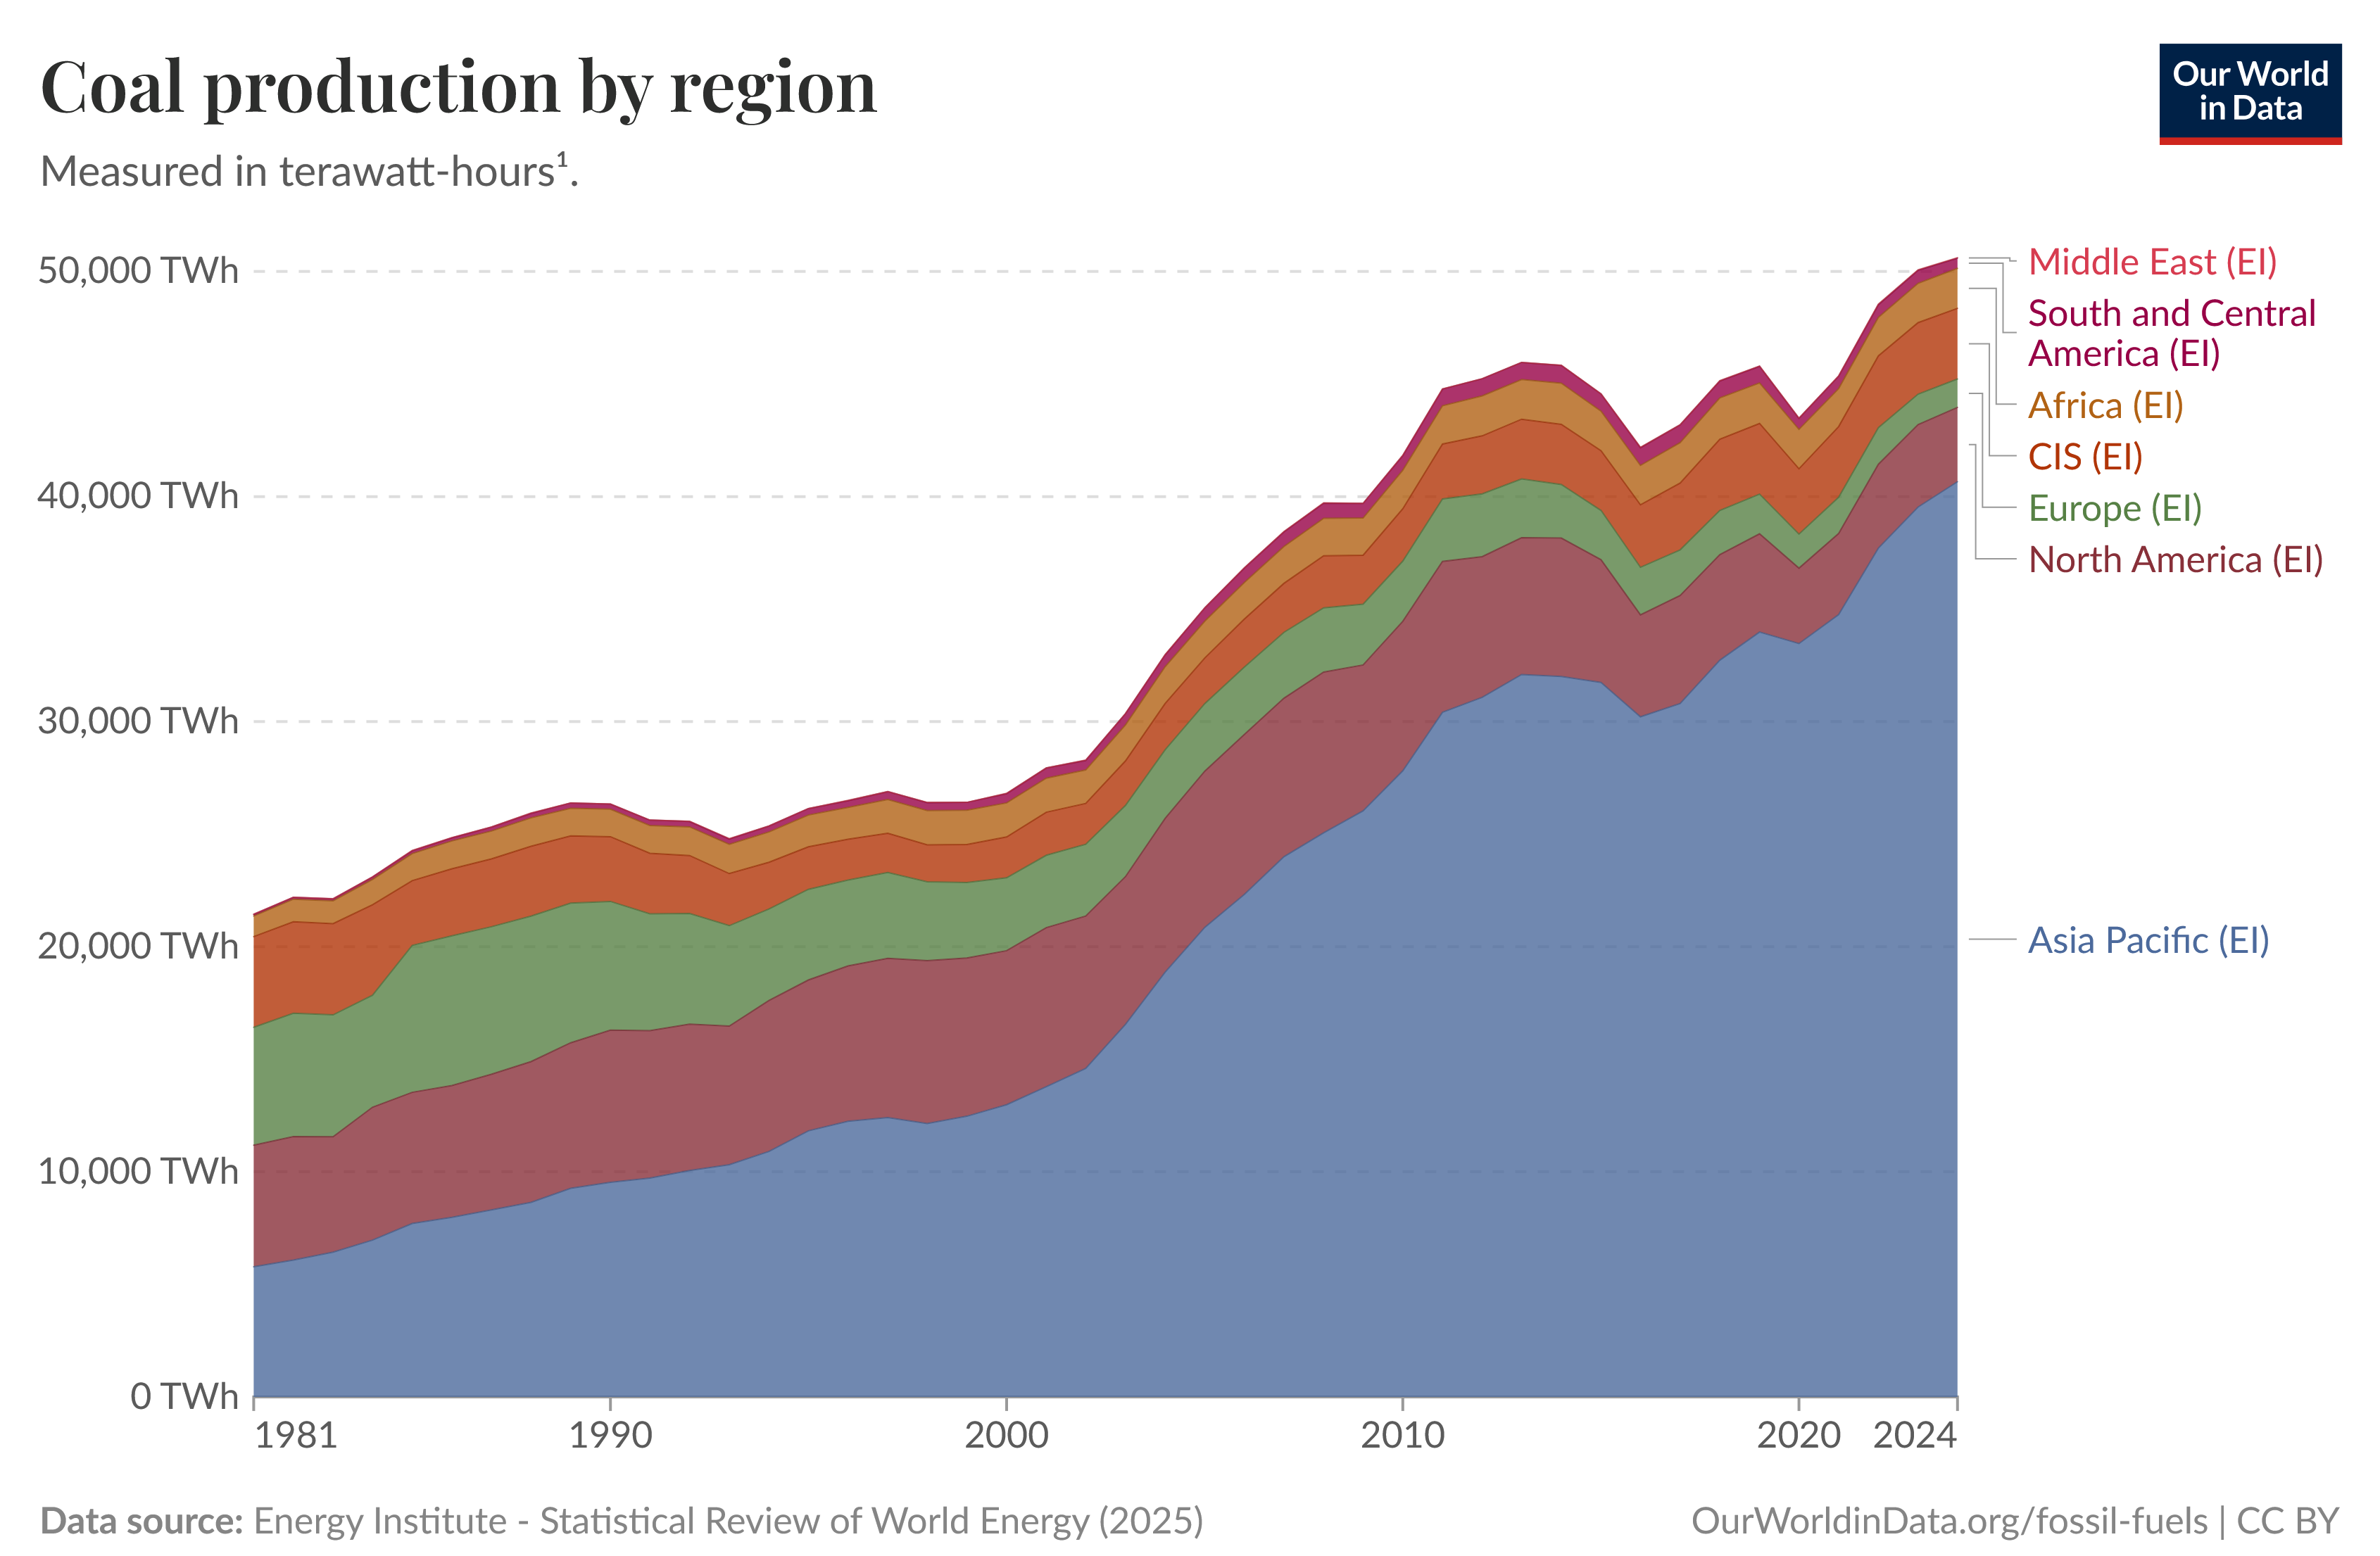
Will consumption of oil, coal and natural gas decline? Probably not, if the trend of the past continues, where increases in GDP have always been accompanied by increases in energy consumption (Fig. 8, 9 and 10). The best we can hope for is that the trend becomes less steep with energy used more efficiently and the gradual shift to renewables.
Since 2000, nuclear power generation has remained more or less constant (Fig. 11). A sharp increase in China compensated a slight decline in Europe. This decline is due to Germany, which did completely shut down all nuclear power plants.
Energy Usage
While the Energy Institute's report concentrates on energy production, the International Energy Agency's World Energy Outlook gives us an idea which sectors use this energy (Table 1):
| Industry | raw materials, production | 40 % |
| Buildings | heating, cooling, lighting | 30 % |
| Transport | road, rail, air, ship | 27% |
| Miscellaneous | agriculture etc. | 3% |
When examining energy data, it is important to determine whether it refers to primary or final energy. The former is typically used when discussing production data, while the latter often refers to consumption data. Some energy is lost during the process of drilling for oil and natural gas, mining coal, refining it, and transporting it to the end user. The end user then converts the energy from one form to another with associated conversion losses. Processes that use oil, natural gas, or coal to generate heat can be more than 90% efficient. However, if this heat is used to generate mechanical energy, as in combustion engines, or electric energy, as in thermal power plants, the efficiency does not exceed 40%. Due to physical limits, we cannot expect major improvements in this area.
However, we theoretically do not need primary energy at all for ongoing electricity production from renewables once solar and wind parks and grids have been built. This drives the trend toward electrification.
Electricity
As part of the rising global energy demand, electrical energy production has more than tripled in the past 40 years (Fig. 12). In 2024 the world needed about 31 250 TWh of electric energy, i.e. a bit less than 20% of total energy.
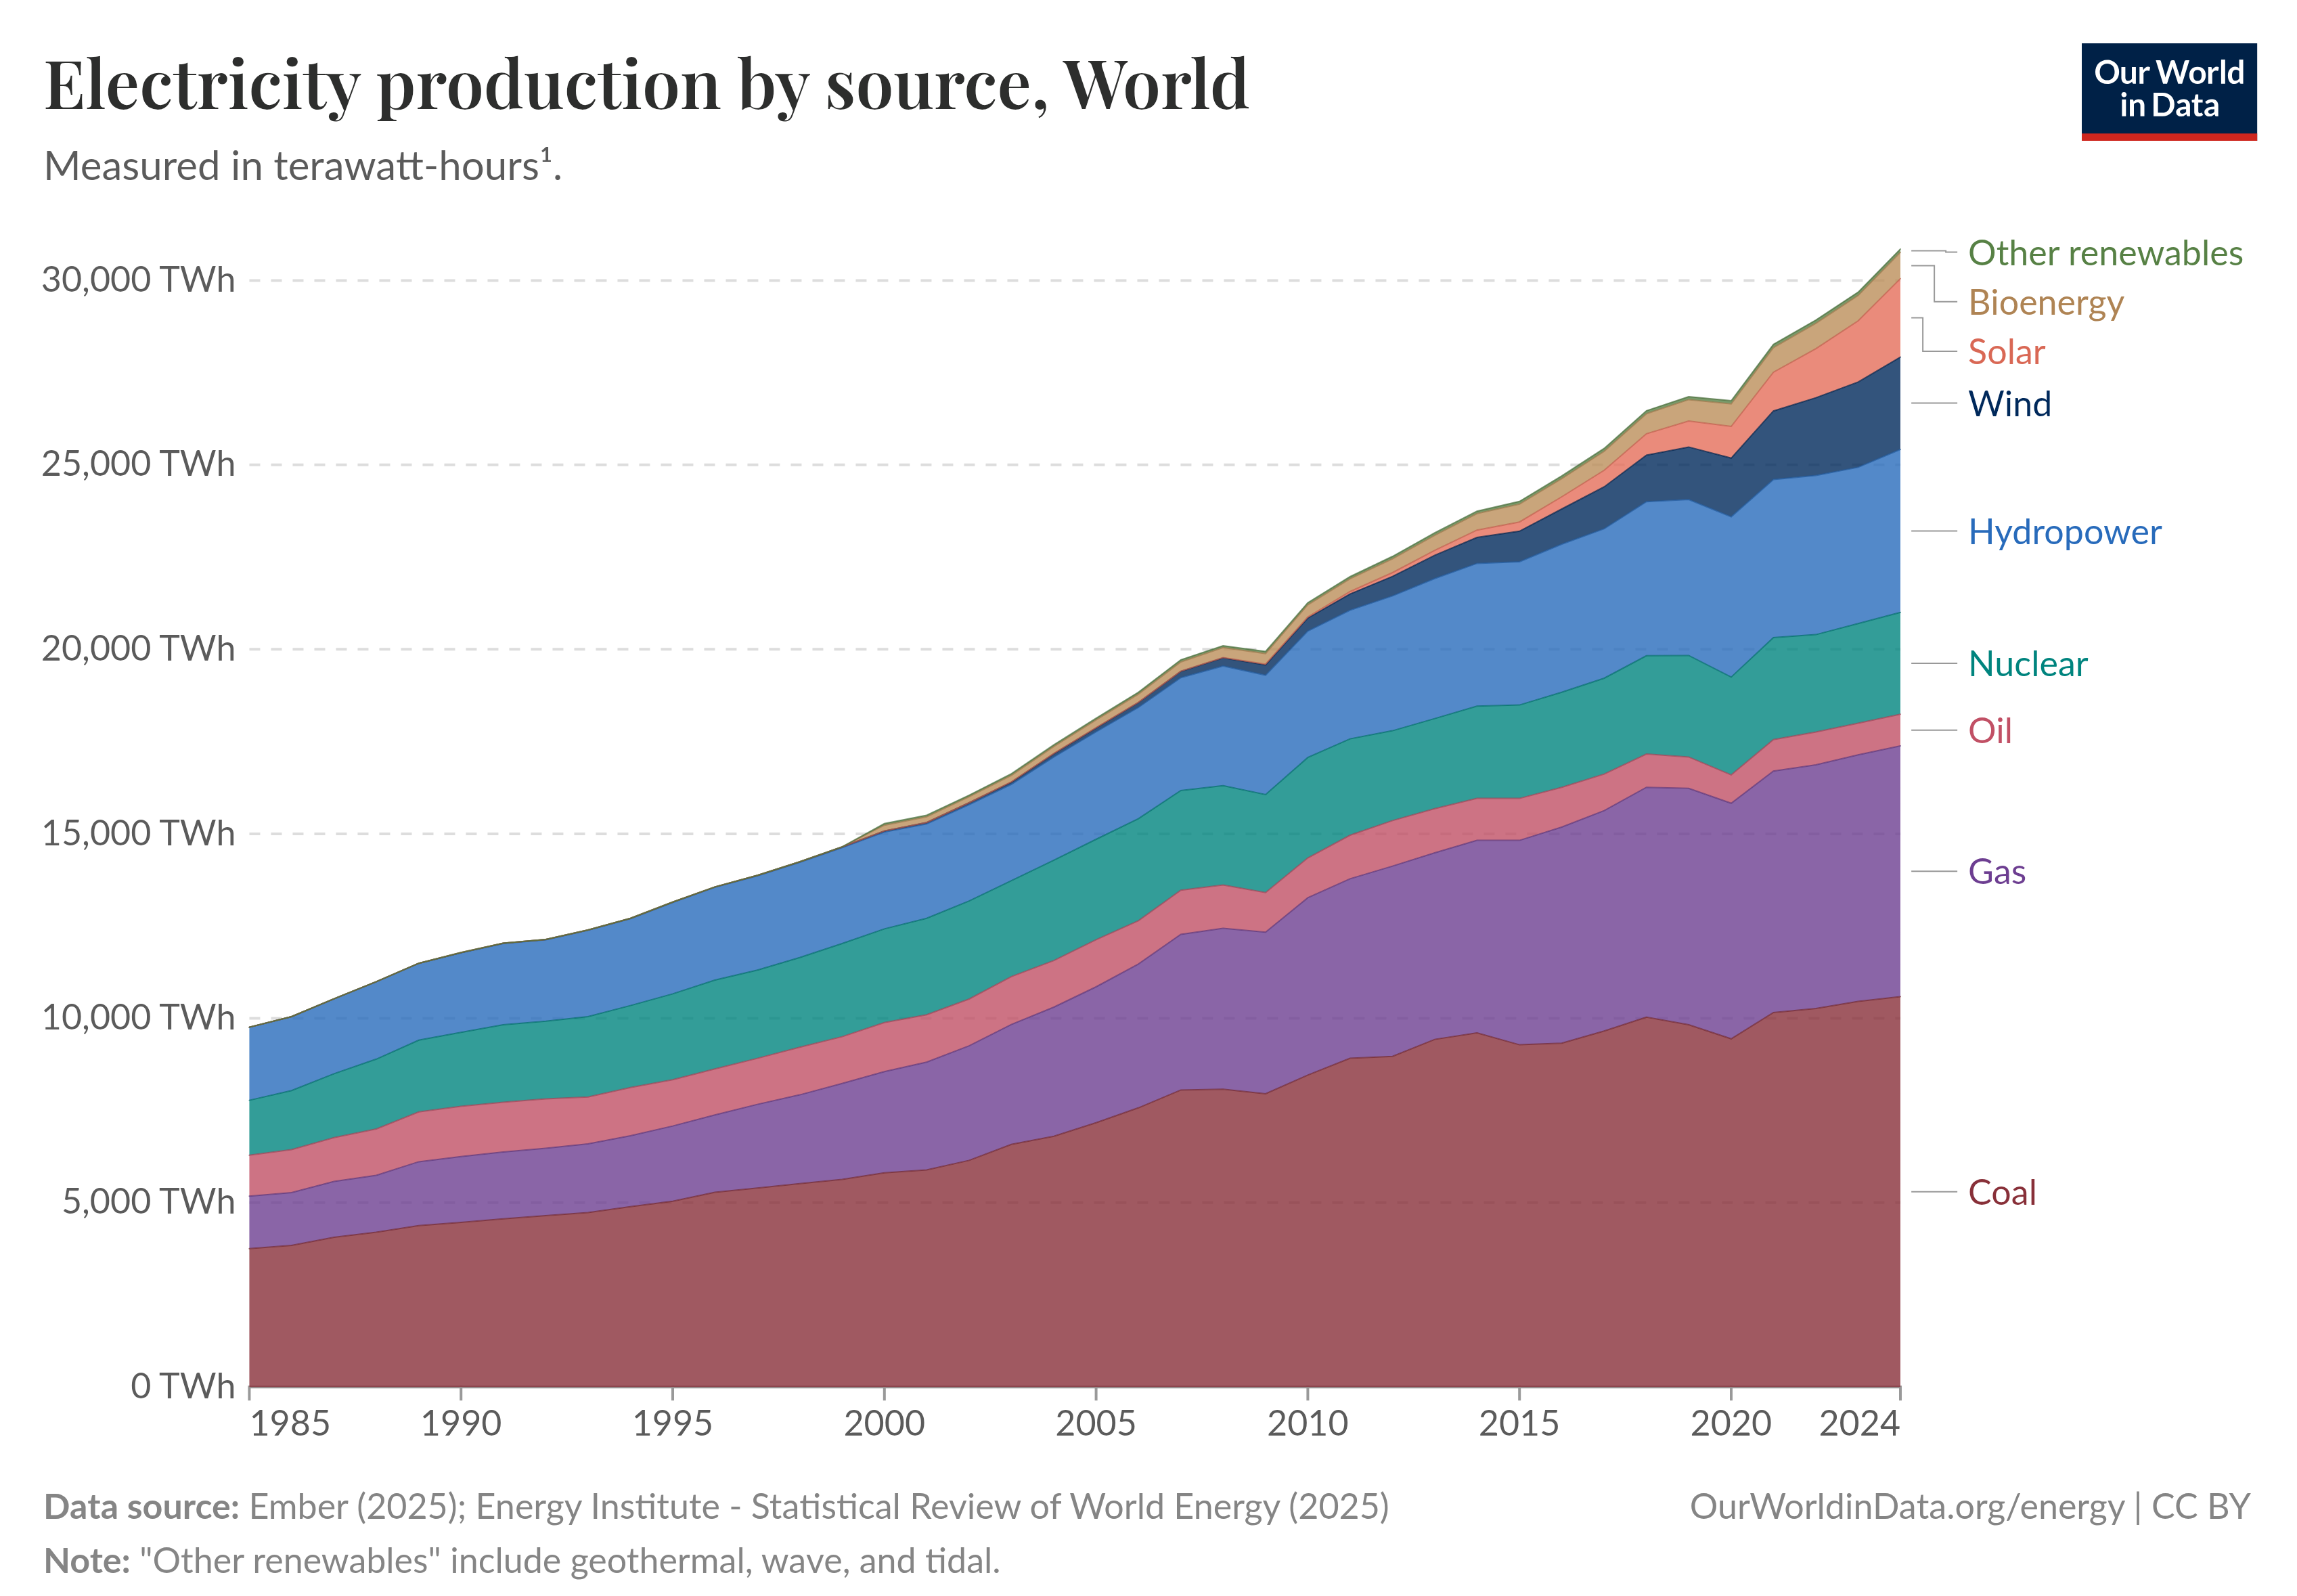
Technically, solar or wind are the most promising sources to further increase electric energy production. But in 2024 60% was still generated by fossil fuels (Table 2). Yes, renewable sources have been rising faster than other sources in recent years. But this is normal for any new technology which starts from a low base. So renewables (and perhaps nuclear) have a long way to go. Especially if other areas of primary energy consumption, such as cars and trucks, were to switch from fossil fuels to electric energy. For more details about global trends in the electricity mix see this article.
And with more electric energy generated by renewables, the intermittent and seasonal nature of solar and wind creates further stress for our electric grid. A topic which I discussed in another post.
| Fossil Fuels | Coal | 34% | ≈ 60% |
| Natural Gas | 23% | ||
| Oil | 3% | ||
| CO2-free Sources | Wind, Solar, Bioenergy | 17% | ≈ 40% |
| Hydropower | 14% | ||
| Nuclear | 9% | ||
| Total Electric Energy | 100% = 31250 TWh | ||
To learn more, get the Global Energy Report 2025, download the data yourself or play with the charts on ourworldindata.org to do your own analysis.
Acknowledgments
Many thanks to the Energy Institute and ourworldindata.org for collecting all the data, providing the report and creating all these informative charts. For older reports see BP's Energy Economics website.
Note
When you compare data of the EI Energy Report, values on ourworldindata.org or from the IEA or other sources, please note that there are various methods to convert energy from different sources into a comparable primary energy value (see pg. 69 of the 2025 edition). This especially affects renewables. Another source of confusion is bioenergy with "modern" sources like biogas and biofuels and "traditional" bioenergy like wood or manure. As for the latter no real trade data exist, estimates for traditional bioenergy may or may not be included in published energy statistics.
Data Sources
- Energy Institute EI: 2025 Statistical Review of World Energy. www.energyinst.org
- International Energy Agency IEA: World Energy Outlook 2024. www.iea.org
- Our World in Data. www.ourworldindata.com
- Free Tools for a Fact-based worldview. www.gapminder.org
Related Posts